

If you are an active day trader, you are probably aware that Fibonacci retracement and extension levels are some of the most important and useful tools in all of price action.
Day traders and technical analysts can use Fibonacci levels analysis to confirm an entry-level, target a take profit, and to determine your stop loss level.
In this guide we will explain exactly how to draw Fibonacci levels, so that you can make better decisions about when to get in and out of trades.
What are Fibonacci numbers and ratios?
Fibonacci sequence, also sometimes referred to as The Golden Ratio, is a series of numbers where each number is a sum of the previous two numbers.
For example, with the string 0, 1, 1, 2, 3, 5, 8, 13, 21, 34, 55, if we add 0+1, we get 1. If we add 1+1, we get 2. If we add 1+2, we get 3, and so on forever down the sequence.
The resulting sequence is known as the Fibonacci sequence and each of number in the sequence is called a Fibonacci number. The Fibonacci ratios are then calculated by dividing numbers across the sequence. These calculations then give us the following ratios that are used in the Fibonacci levels.
0, 0.236, 0.382, 0.5, 0.618, 0.786, 1, 1.618, 2.618
The ratios get translated into percentages – 23.6%, 38.2%, 61.8%, 78.6%, etc. – which are then applied to the chart to try and identify potential hidden support or resistance levels in the market.
The Fibonacci sequence was discovered in 1202 by an Italian mathematician known as Leonardo of Pisa, while considering a practical problem involving the growth of a hypothetical population of rabbits based on idealized assumptions.
This sequence governs many aspects of life; from the creation of flowers, the formation of waves, to proportioning of the human body. It also provides the information that traders and technical analysts need to formulate resistance and support levels which can be used within a risk management framework.
You can use Fibonacci retracement levels on their own or combine them with other trading methodologies.
The Fibonacci sequences were used to formulate other theories such as the Elliot Wave Principle and Dow Theory. You can also use Fibonacci ratios with other technical analysis tools.
How Fibonacci retracement levels are calculated
One of the most common technical analysis tool derived from the Fibonacci gold ratios are the Fibonacci retracement levels.
The 61.8% Fibonacci ratio and the 38.2% Fibonacci ratio are calculated by subtracting the recent high from the recent low and targeting the impending rebound. Most of these points are can be calculated using charting software.
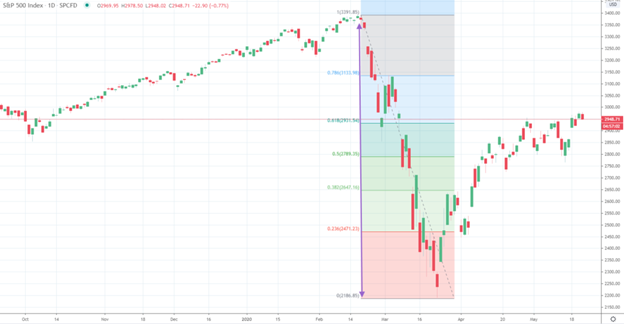
The Fibonacci Retracement levels usually behave like magnets creating a self-fulfilling prophecy as show in the S&P 500 index chart above.
As you can see from the chart, the realization that the coronavirus pandemic would batter the U.S. economy triggered an instant bear market starting in February and reached a bottom in March. Prices fell from about 3,400 to 2,200 and then bounced back to the 38.2% retracement level.
If we take the decline and multiply it by 38.2% and then add that figure to the low (2,200), we would get the 38.2% Fibonacci retracement level, which is 2,647. The index began to consolidate at this point.
After the consolidation period, prices retested the 38.2% retracement level and broke to the next level which was the 50% retracement. The consolidation was brief. The S&P 500 index then moved to test the 61.8% retracement level and has consolidated around that region.
When you draw Fibonacci retracement lines, you will measure the peak to trough of the move that you are targeting. The difference between the high and the low is then multiplied by 61.8% and 38.2%.
These results are added to the low if you are measuring a drop, or subtracted from the high if you are measuring a rise. These levels will become your target support during a correction or resistance as the price is rebounding.
How to draw Fibonacci levels on a chart for trading decisions
Fibonacci retracements
The Fibonacci retracement tool is designed to help traders know where and when a retracement will end. This tool similar to support and resistance because it marks levels where the price of a security might reverse during a retracement. But the main difference is it does this automatically, through the use of a tool, instead of you placing the levels manually. So, how can you draw it on a chart?
Drawing Fibonacci retracements in an uptrend
The first thing you need to do is to examine the most recent price action and identify a significant swing high and swing low.
After you locating these two points on the chart, select the swing low and drag the cursor to the swing high point. You can then use the two reference points as the basis for the Fibonacci levels that will then be plotted automatically on the chart.
Drawing Fibonacci retracements in a downtrend
To plot Fibonacci retracement levels in a downtrend in a down trending market condition, you need to select the most recent significant swing high and low points.
Start with the swing high point, and then drag the cursor down to the swing low point. After selecting these two points, your Fibonacci retracement tool will then automatically generate the relevant Fibonacci levels.
Fibonacci extensions
Fibonacci extensions simply refers to levels that go beyond the 100% level. These levels work just the same as retracement levels, but chartists only use them to map out how future swings are likely to happen rather than retracements.
Fibonacci extensions also follow the same number sequence; 23.60%, 38.20%, 50%, and so on. However, they all have a 1 in front – so 38.20% is 382.00% – since they appear past 100% of the swing rather than inside.
Drawing Fibonacci extensions
When drawing Fibonacci extensions, the first thing you need to do is to find a trend or swing you want to use as a base. So, find and select two swing points, and stretch the Fibonacci extensions tool between the two edges of that swing.
If you are measuring a bullish swing, you need to stretch the indicator beginning from the lowest to the highest point of the swing. On the other hand, if you are measuring a bearish swing, then you stretch the tool starting from the top to the bottom of the down move.
Basically, the idea is to have the 0.00% level at the end of the swing that you take as a base. Once you stretch the tool, the Fibonacci extension levels will be plotted automatically on the chart.
Bottom Line
Learning to trade the market using Fibonacci levels is not really hard.
They are one of the most useful technical analysis tools that you can use to day trade stocks and other financial securities.
Traders mainly use Fibonacci levels to identify resistance and support levels. When a stock is in an uptrend or downtrend, it usually makes a slight pull back before continuing the trend.
Often, the stock will retrace to a key Fibonacci retracement level like 61.8% or 38.2%. These levels offer signals for traders to get into new positions in the direction of the original trend.
If the stock is in an uptrend, you might look to buy on a retracement down to a key support level. If the stock is in a downtrend, you could sell when it retraces up to its key resistance level. Simply put, the Fibonacci levels work best when a stock is in an uptrend or downtrend.