

Many trading pundits claim that you can use the same trading strategies and tactics across all stocks, bonds, or any asset.
In other words, they claim you should be able to trade Apple stock in the same way that you’d trade the Russian Ruble.
Besides the fact that there are literal differences between the market structure in different asset classes, but there’s a myriad of significant reasons why different financial assets should trade differently.
Many of you are well aware of how differently stocks can trade, as a result of repeatedly poor performance with one or a small group of stocks, compared to the rest of the stocks you trade.
Identifying Your Poorest Trading Stocks
In reading this, you might have several stocks which immediately spring to mind. They’re stocks that you seem to always lose money on, or maybe they’re the stocks where you make your biggest losses, or maybe they just behave differently from the stocks you’re used to trading.
If that’s the case, move onto the next section. But, maybe you’re such an autopilot trader; treating every stock identically (and trading so many different stocks), that you’ve lost touch with some of the individual character that each stock carries. In this case, it might be prudent to identify if you have any weak points using statistics or trade review.
The simplest way to do this is by using your trading records, which are hopefully easily sortable in a database like on TraderVue or an equivalent piece of software.
Then simply filter by every stock you’ve traded X number of times (X can be more than 50 trades for a day trader, or maybe more than 30 times for a swing trader), and sort by your poorest performing stocks.
The graph might look something like this:
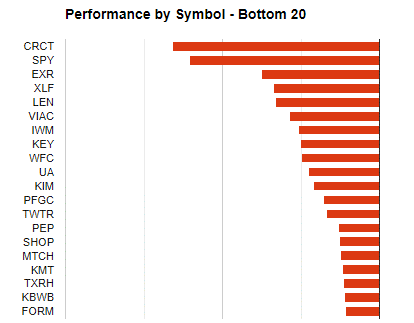
From here, you can start to make inferences. Maybe you see a lot of “new-tech” stocks on there. Stocks like Tesla with potential to change the world.
Before you jump to any conclusions, though, you really shouldn’t perform this analysis unless you have a large sample size of trades for that stock. You can’t make inferences off of 6 trades where 5 of them went badly. We’re not playing chess, we’re playing something closer to poker: a winning strategy doesn’t win every time.
The actual number of trades you need is: more. The more the better.
Understanding Why You Trade This Stock Poorly
Let’s be clear, getting to the “why” in financial markets is not a trivial task. So much of what happens in the market is random, or unexplained. We don’t know who is trading, at what times, or why they’re trading. Oftentimes we’re left guessing and estimating to surmise why a specific price trend occurred.
This lack of concrete information is the reason so many traders shun reading the news or financial reports and instead focus their trading efforts entirely on price, volume, and market forces.
One way to suss out why you might be trading a stock poorly is by comparing your best and favorite stocks to the laggard. Can you see any qualitative similarities between your favorite stocks? Are they in a specific sector? Is there something notable about the trading population of these stocks?
Let’s say you review your favorite stocks. You find a few regional banks, some utilities, and blue chips like Coca-Cola. Clearly you’re pretty good at trading boring, stable stocks.
On the other hand, your biggest losses are repeat offenders in the “flavor of the week” category of stocks. I’m talking about stocks like Plug Power (PLUG) or AMC Entertainment (AMC). These stocks clearly have a very different crowd trading them than your boring blue chips, and that could play a huge role in why you can’t trade them well, especially if you’re using your boring blue chip strategy on these runners.
Or maybe you notice that you’re doing really poorly trading precious metals over the last six months. Well, the price of gold and its associated indexes have been steadily downtrending over that time period, so if you traded those with a long-bias, you’re very likely to end up losing money.
These are simple insights but if you don’t take the time to actually analyze the data, you’ll be missing them.
Study The Price Action Tendencies
If you’ve verified that there’s statistical validity behind your hunch that you’re bad at trading a specific stock, you might be trying to shove a square peg into a round hole. In other words, the trading setups you’re taking on this stock just don’t react with the stock’s DNA.
Maybe you fade big morning moves, but this is the type of stock that tends to steadily trend all day in a low-volatility fashion with few pullbacks.
Or maybe you look for pullbacks in intraday trends but this stock is guilty of the constant head-fake, reversing most of its moves before a sustained trend starts. Or maybe it seems to respect its support and resistance levels less than your usual stocks.
While it’d be easy to just open a chart of this stock and start analyzing the price action, it’s unlikely that you’ll make any breakthroughs that way because of lookahead bias.
If you’re trying to analyze price action when you can see what’s coming next, your brain isn’t forced to figure out the most likely path for a stock, you’re just looking at some price bars.
Instead, use a charting software that allows you to scroll one bar at a time as if the trading is unfolding in real-time.
This way you can make in-the-moment insights that aren’t clouded by knowing what’s coming next. TradingView has a “replay” feature that allows you to do this easily, however, it’s easily achievable in nearly all charting packages by simply hiding what you don’t want to see and revealing one bar at a time.
Stop Trading Them!
Specialists usually win, especially in trading. If you’re bad at trading a stock, there’s nothing wrong with just abandoning it.
Of course, you always want to improve and simplicity isn’t an excuse not to do so, but consider the fact that many of the world’s best traders only trade one asset class, or in some cases, just one asset period, like oil trader Andy Hall who earned $100 million in 2008 alone, trading almost only oil.
Randomness
Even if you’ve built up a decent sample size of bad trading performance for one stock, you still can’t escape the fact that it might be due to sheer randomness.
The markets are chaotic and you might luckily lose or win 20 trades in a row with a solid trading strategy.
If there isn’t an obvious, jump-off-the-page reason that explains your specific underperformance with this stock, maybe there isn’t a reason.
You might have gotten unlucky, but there also could be some unknowable reason too ephemeral to figure out.
It’s more of a personal choice to decide if you should stop trading these even if you can’t explain why, or to keep trading them until you have a compelling reason not to.
Bottom Line
If you’re struggling with one specific stock, that means you’re probably quite successful trading most of your other stocks, so don’t be too hard on yourself. Trading profitability isn’t an easy feat.