

What is a Breakout Trade?
A breakout trade is when a stock breaks above or below a significant support or resistance level after failing to do so in previous attempts. The break of this significant channel can bring about a huge price move and a new trend. This setup is most alluring to new traders because of the potential for home run trades.

When a breakout occurs, the market is telling you that there is a shift in supply and demand. As bulls or bears become more aggressive, this can lead to an imbalance large enough to sustain the breakout through the channel. It’s key to watch the volume.
However, most breakouts fail. And over time, they’ve been failing at a higher rate as markets modernize and become more efficient. Here’s a graph from Thomas Bulkowski’s chart pattern failure rate study:

Since the dot-com boom, the failure rate of breakouts has been climbing. Unfortunately, Bulkowski hasn’t updated the study post-GFC.
This isn’t to downplay the breakout as a setup. It has it’s applications and there are many successful breakout traders. The problem comes in identifying the high probability breakout setups from the rest of them.
In this article, we’ll show you how to analyze a breakout setup and determine if it’s worth your trading capital.
What is a Failed Breakout?
A failed breakout is when price momentarily breaks through the support or resistance level, but is quickly rejected. The market usually falls back into the price channel it was in before after a failed breakout, sometimes it breaks down below the price channel.
This usually occurs because the level we thought was important was insignificant. As humans, sometimes we recognize patterns that aren’t there, especially when we’re looking for them. Once you become familiar with the concept of support and resistance, your eyes begin scanning for it on every price chart. Many times, instead of being a level of significant supply/demand imbalance, it’s simply a level where price happened to trade at a few times.
There are traits unique to successful and failed breakouts, that if applied to our trading, can shift the odds significantly in our favor.
Unfortunately, this isn’t as easy as punching some metrics into a stock screener and buying at a given indicator reading. Identifying high probability breakouts will take some chart reading skills.
Components to a Successful Breakout
The best breakouts usually break out of very obvious, well defined support or resistance levels. These are levels of massive supply and demand, and when broken, can lead to a buying or selling frenzy.
We need to be able to not only identify these important levels but identify the behavior of a stock before it breaks out.
In Harmony With Long-Term Trend
Taking breakout trades in the direction of the long-term trend puts the probabilities further in our favor. If we’re trading a breakout on a 15-minute chart, it’s smart to confirm the long-term trend is in the direction of the breakout on hourly and daily charts.
Large institutional buyers create and sustain trends. If the market is trending meaningfully in one direction over time, there are plenty of large institutions putting a lot of capital after supporting that move. Going against those moves is like trying to picking up pennies in front of a steamroller.
As long as the trend isn’t getting overextended, and is in the process of climaxing, trend continuation is more likely than a reversal, so play the odds!
High Volume
Remember: a breakout is signaling that there was just a shift in supply and demand. Volume is a key component to this shift. If the breakout happened on low volume, the level of aggression is low and the move might not be sustained. Even worse, the move might be a fake breakout.
High volume on a breakout signals that institutions, not just traders, are behind the move. Institutions defend their positions through continued buying and selling. They’re continuously accumulating and distributing because of the constant need for rebalancing due to asset outperformance and new asset inflows.
Because of this, when you see a breakout on high volume that is in the direction of the long-term trend, that probably means the institutions who own the stock are in a state of net-accumulation. In other words, while there may be some institutions selling, there is more buying going on then selling.
A moving average of volume is a great way to see how significant the volume is. Swing traders typically use a 50-day average, and want to see at least 150% of the MA on a breakout, ideally more.
Significant Support or Resistance Level
Remember when we talked about fake breakouts earlier? The main reason for them is traders misinterpreting a random level as support or resistance. Just because the market has traded at a level several times and changed directions shortly after does not make that level support or resistance.
It needs to be an area where there is a significant shift in supply or demand. At a support level, buyers get more aggressive and buy up all of the supply, and vice versa for resistance.
The best way to confirm if a level is truly support or resistance is through the use of volume. Volume should pick up around these levels.
A traditional volume histogram isn’t the only way to confirm levels. In fact, it doesn’t really tell the whole story. A volume profile (also called market profile) gives you much more context. Volume profile shows you how much volume executed at every price. See an example on Apple below:
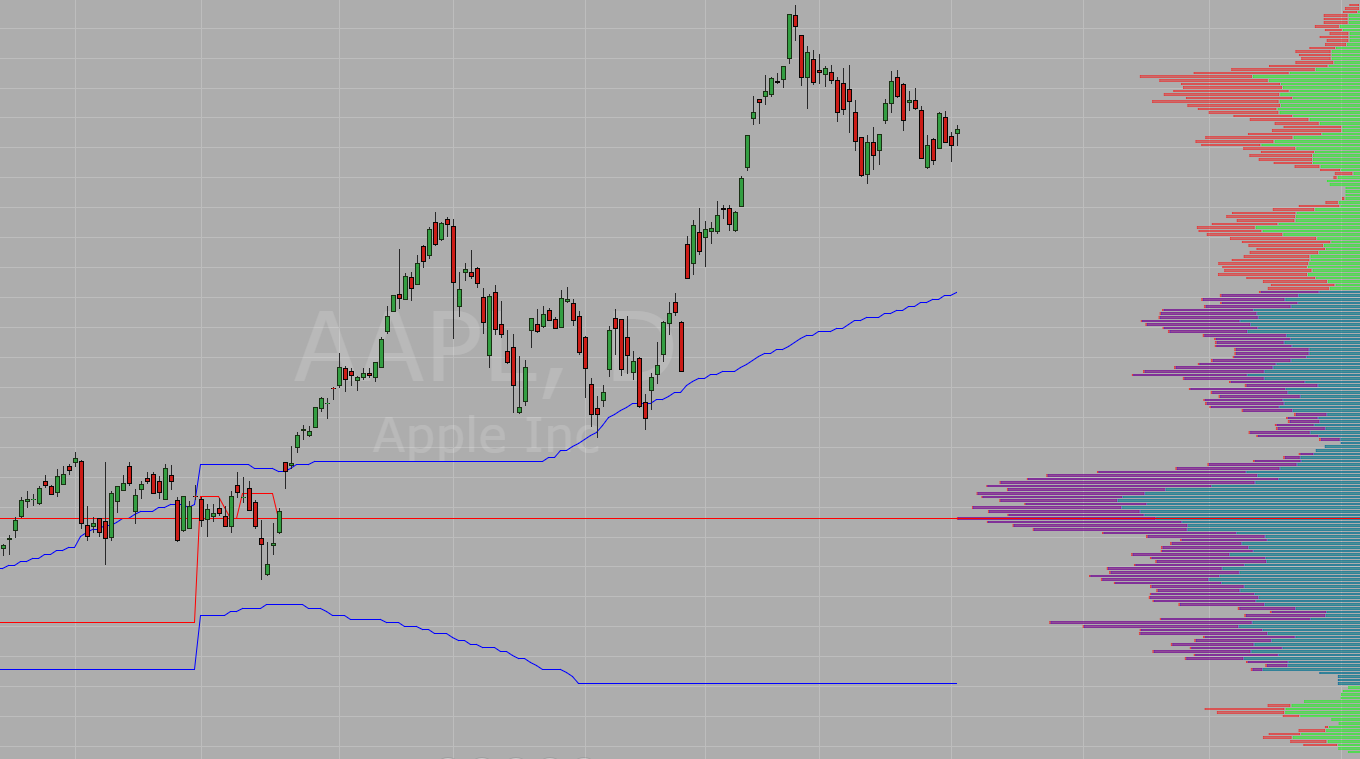
Many levels that traders consider to be support or resistance or simply random levels at which the market happened to trade at several times. The difference between these levels is that volume picks up significantly at these levels.
Confirming levels is more art than science.
High Volatility
The best breakouts are accompanied by huge increases in volatility. The price bar that breaks outs should have a very wide range.
Considerable slippage when entering on the breakout is a good sign. Bad fills are telling you that traders are jumping over each other to get into this stock.
Trending into Support or Resistance
One of the strongest signs of an impending successful breakout is a narrowing trend into the level.
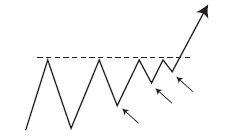
Chart from The Art and Science of Technical Analysis
We can see in the chart above that upward buying pressure is mounting against the resistance level. Demand is beginning to outweigh supply as bulls tighten the range between the most recent low and resistance.
Stop Placement
Where you place your stops can make a big difference in your trading account. The first step is to become oriented with the why behind your stop loss.
It’s important that your stop placement has a reason it’s at that level. Many traders place their stop loss at random prices, because that’s the price where they’d lose their maximum risk level. This usually ends with the trader being shaken out of the trade because they tried to take too much risk and as a consequence, had to have a tight stop.
A common breakout stop placement tactic is to place your stop below the most recent swing low. Here’s an example in Apple (AAPL):

We can see that Apple has tried and failed to break through the $215 level (green line) several times. Perhaps this is a setup you’re going to take when it breaks above $215 again, you may opt to place your stop around $194, the most recent swing low (red line).
This is a very wide stop, which has it’s pros and cons. You’re giving the setup a lot of room to play out, making it much more likely for you to catch an explosive breakout. On the other hand, this would be a decently sized loser.
Another common and sound stop placement tactic used by advanced traders is using a multiple of the stock’s volatility. To quantify the stock’s volatility, we’ll use a 14-day Average True Range indicator reading and multiply it by 2.
We’ll place our stop $10.46 (2x ATR) below our entry. Let’s assume our entry is at $215.25, slightly above the breakout level. That would leave our stop at $204.79, making it much more palatable than using the swing low example above, which works out to be around 4x ATR.
Entering Breakouts
There are three places to enter a breakout:
- Prior to the breakout
- On the breakout
- After the breakout
Each style carries its own pros and cons from a reward/risk standpoint.
Entering Prior to Breakout
The power of entering a trade prior to the breakout is you get to avoid the high slippage and volatility incurred when you enter on the breakout. You also get a much better price than those who enter after the breakout occurs.
We talked about when price trends in the direction of the level and the range narrows. Entering on a higher low (vice versa for downtrends) of that trend is a perfect pre-breakout entry.
Entering on a Breakout
This one’s self-explanatory. Set an order right outside of the significant level and wait to get filled. Mange your trade from there. You will incur higher slippage and volatility but, you’ll get quick feedback on if the trade is good or not, possibly allowing you to jump ship before you get stopped out.
Entering After a Breakout
This generally involves buying on the first pullback after a successful breakout. The pullback should be a higher low (vice versa on short side), not a pullback back into the prior channel.
You benefit from confirming that the breakout was a real shift in supply/demand. After waiting for short-term traders to take their profits, causing a pullback, you get to ride the new trend. The cherry on top is you get to place a tight stop, right below the significant level.
Summary
The best breakout traders say that the market will tell you almost immediately if a breakout trade will work. If price is fluttering around a tight range after ‘breaking out,’ perhaps there was no real breakout at all.
While many try to steer new traders away from breakouts because they think of the instant gratification as dangerous, it can serve the right type of new trader.
Anytime you’re able to receive quick feedback when learning a skill, that opens up opportunity for rapid improvement if you continually iterate. A new trader who has discipline can become proficient in this setup quite quickly when learning from mistakes and continuously learning.