

What is Trend Trading?
Trend trading is a strategy that involves traders waiting till a defined trend has been established in a stock before taking a position. This can be done by buying shares in the stock if it is trending higher or selling shares short if the stock is trending lower.
Trend trading can also be done on different times frames so whether you are day trading, swing trading or investing on a longer time frame, trend trading can help you stack the odds in your favor.
What is a pullback in trading?
A pullback (often referred to as a ‘retracement’) is a temporary pause in an existing or ongoing market trend. A pullback often occurs after a large move in the direction of the trend. The price usually ends up retracing to a median level after this impulse move.
This strategy capitalizes on the fact that markets are noisy and rarely do they move straight up or down, even in a strongly trending state. If there is still adequate momentum, entering around a trend’s ‘mean’ price following a pullback should be a good bet. Despite the price pulling back, the long term trend is still intact.
The trend pullback trade is as simple as it gets:
- Find a trending market (we’ll show you how below)
- Wait for the trend to make an impulse move and overextend
- Enter the market during trend weakness
There are several ways to do this, some involving sophisticated if-then scenarios, some involving looking at a bunch of charts and choosing the nicest looking setup based on discretion. They all revolve around entering a trending market during a period of temporary weakness.
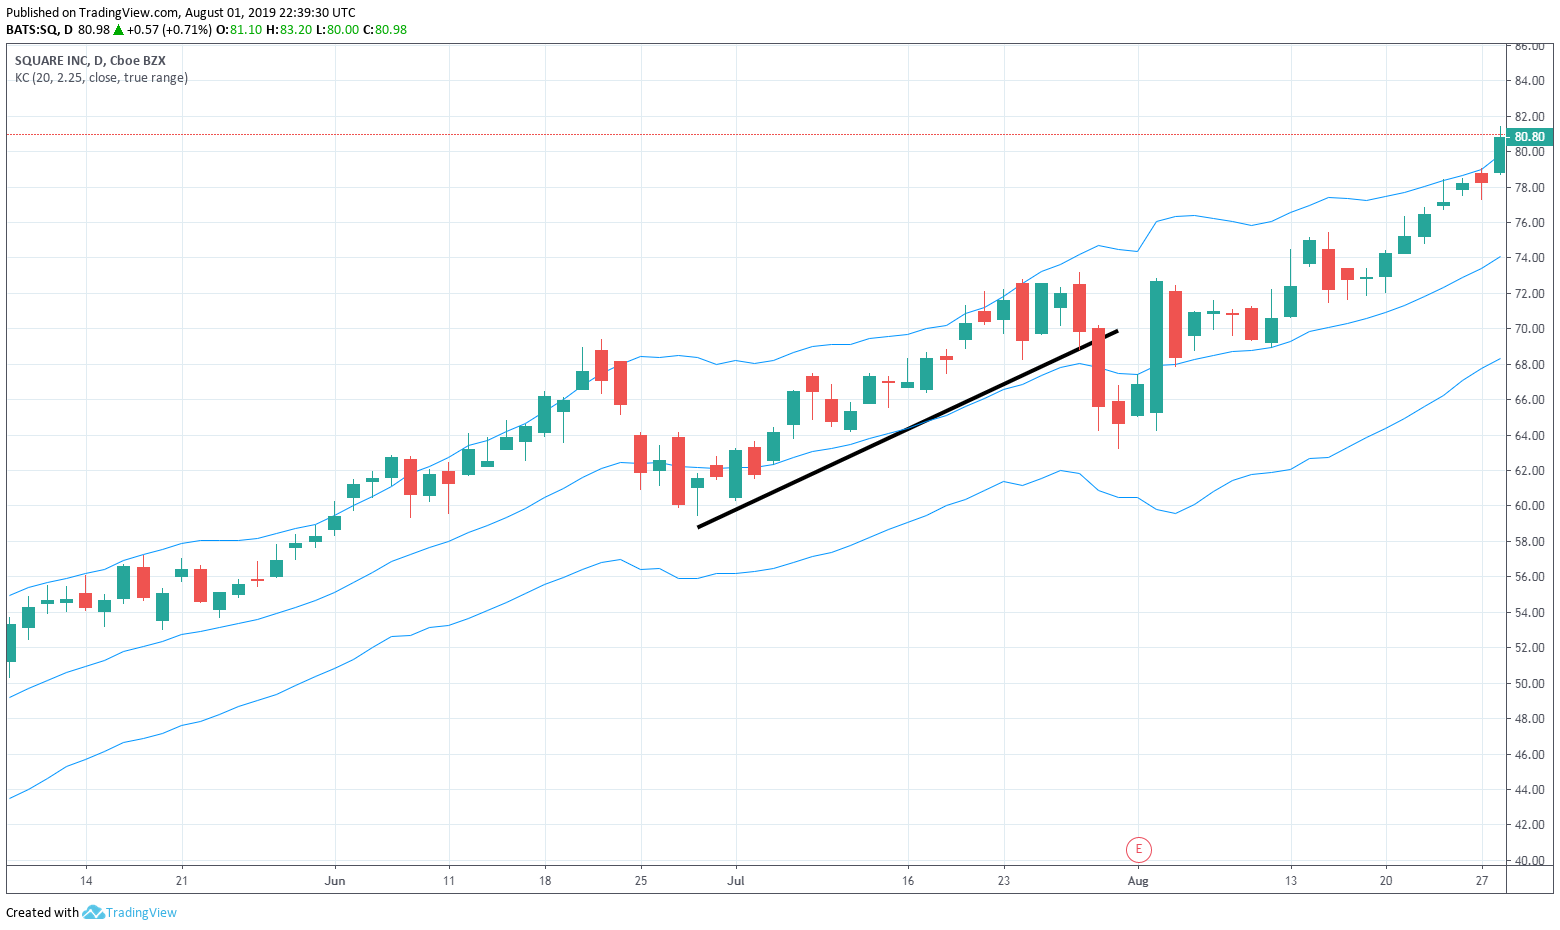
As you can see, the trend begins to get overextended and begins to mean revert, soon to continue its upward trend. The above is a textbook example of a good trend pullback setup.
High Probability: Pullbacks vs. Breakouts
As a trend follower, there are essentially two methods of entry which most strategies fall into: pullbacks and breakouts.
Breakouts are generally big winners when they’re successful, but most breakouts fail. You must accept frequent losses if implementing a breakout strategy.
Pullbacks, on the other hand, are much higher probability than breakouts, but the winners are smaller. All things being equal, there are immense psychological benefits to winning often. Rather than catching the huge initial move as you do with a breakout, you catch the move from the “mean” back to the top of the trending channel.
The chart below shows the failure rates of breakouts. From Thomas N. Bulkowski’s Trading Classic Chart Patterns

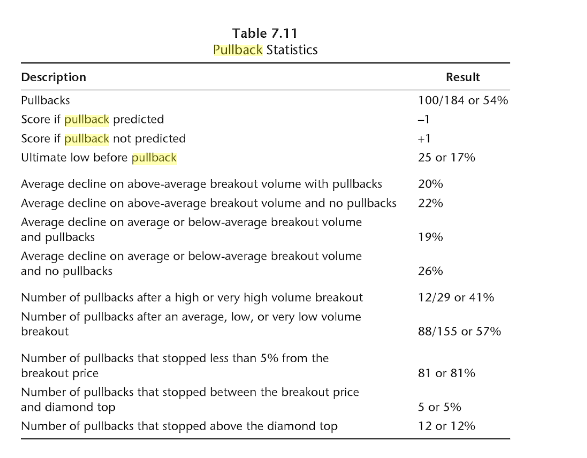
On the other hand, here are some statistics on the price tendencies after a pullback occurs. From the same book:
Trend Trading Strategies: The Strategy Works
Several notable traders and analysts have backtested various trend pullback trading styles, and the results are usually overwhelming positive. As shown above, Bulkowski’s data shows the statistical reliability of this pattern repeating successfully over a reasonably large dataset.
Let’s look at a more focused study of pullbacks from the wonderful JB Marwood. He compared a SPY buy & hold portfolio to buying pullbacks in the SPY. The results were quite positive for pullback traders.
Note the risk adjusted return of the pullback strategy.
Identifying Trends
If we want to successfully trade trend pullbacks, the first step is being able to identify if a market is trending or range-bound. The pullback pattern doesn’t apply in range-bound scenarios, as there is no real trend in price direction, so there’s no reason to expect that the market will bounce back following the pullback.
Trend identification, despite the several philosophies and indicators revolving around it, is quite simple. A trend is simply a series of higher highs and higher lows (vice versa on the short side). The more consecutive higher highs and lows in a row, the stronger trend.
Further, the more defined these points are, the stronger the trend. Much of the time, trend identification is a qualitative act. It takes ample experience reading charts.
Let’s take a look at a trend on the long side. As you can see, each consecutive high is above the previous high, and each low is above each previous low. Until this cycle breaks, this market is considered to be in an uptrend.
These are the fundamentals of trend identification. You don’t need to see an ADX reading of 30, a MACD ‘golden cross’, or a moving average crossover. Price action is all you need.

While price action is the most important trading indicator, I also use Keltner Channels with a 2.25 ATR multiplier around a 20-period moving average. These bands act as a visual guide, and don’t drive trading decisions.
Trend Strength
You may agree that trend identification starts with price action, but sometimes indicators can act as great filters to find the highest probability setups, with the strongest trend with tools like screeners and scanners.
Here’s some indicators that will help you identify trend strength:
New Highs and Lows
There was once a trader named Richard Dennis who struck it rich in the commodities market with a completely rules-based system based on entering trades on new 20 or 55 day highs or lows. Dennis got famous when he taught several other traders, whom he referred to as his “turtles,” to also strike rich with the same trading system.
To Dennis, an intermediate term trend began on a new 20 day high or low, and a longer term trend began on a new 55 day high or low.
Richard Donchian, another commodities trend follower, developed a trading bands indicator called Donchian Channels, which plots periodic highs on a chart. This indicator makes noticing these new highs and lows quite easy.
You can filter for these opportunities by searching for new highs in your preferred stock screener.

20-day Donchian Channels on GOOG daily chart
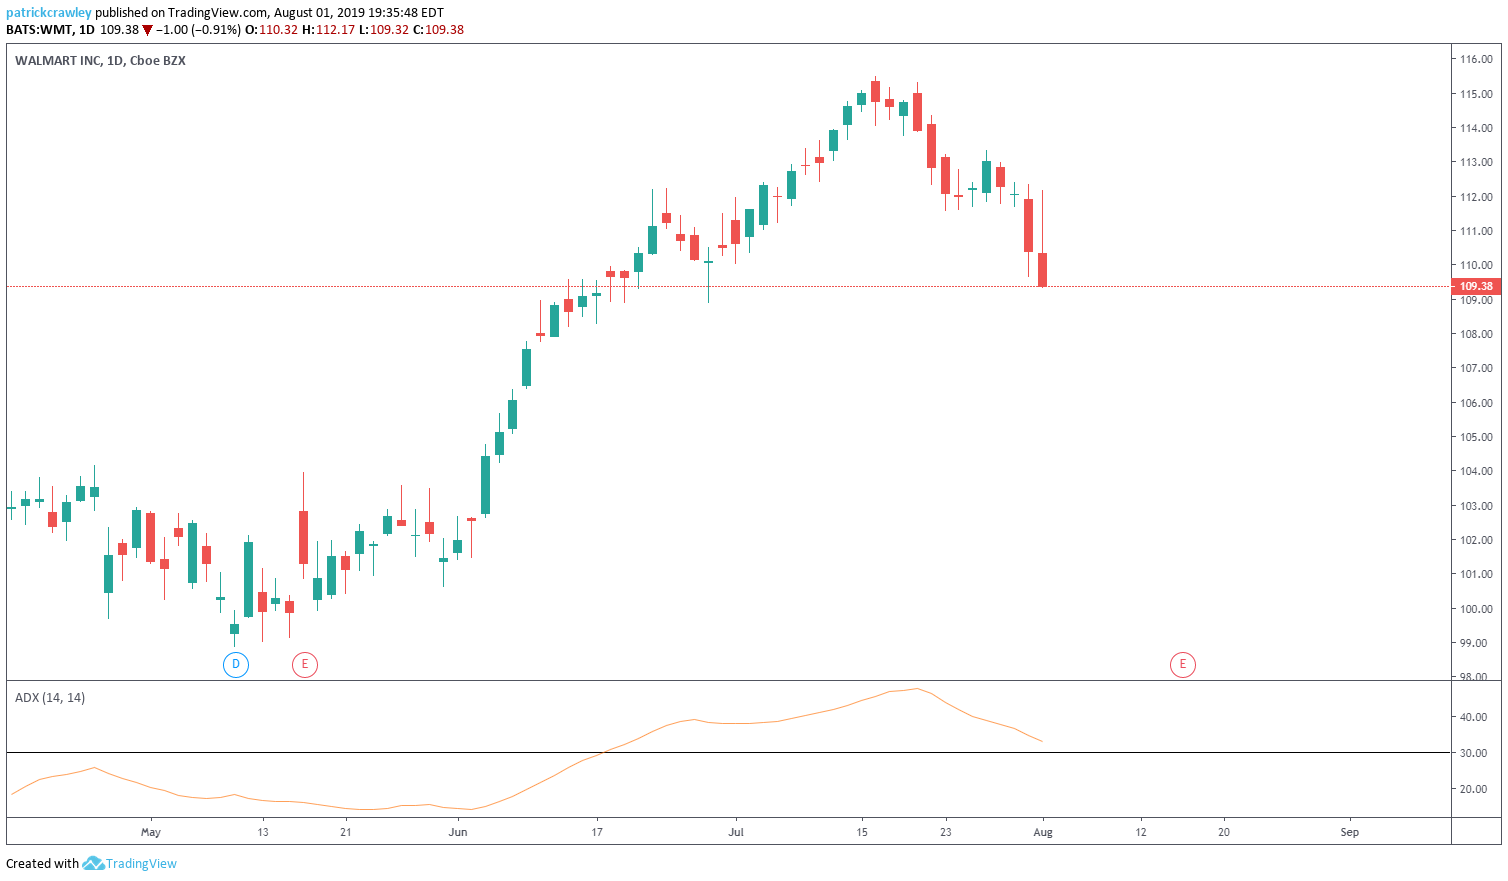
Average Directional Index
The ADX is a very simple way to get a sense of historic trend strength. The ADX is agnostic to direction, and only quantifies the strength of the current trend’s movement.
The ADX doesn’t allow for much analysis, but it’s great to filter out stocks that aren’t trending as strongly. Typically, a reading of 30 or above constitutes a strong trend. Simply adding a >30 ADX filter in your screens is likely to improve the opportunities you’re looking at.
Applying an ADX filter is bound to make you miss out on opportunities, but it’s a great way to limit the amount of charts you look at if you’re limited on time.
Word of Warning
The ADX, like many other oscillators, is a heavily lagging indicator, meaning that price action might tell a different story than ADX. Often times when stocks are at ridiculously high ADX levels, the trend is climaxing and a pullback or reversal is imminent.
Identifying a Pullback
If you feel confident identifying a market trend and its strength, the next step is identifying what a pullback would look like within that trend.
Conceptually, this is what a pullback looks like:
- Large impulse move in the direction of the trend
- Consolidation in the opposite direction of the trend
Pullback vs. Reversal
Sign of Pullback: Low Volume
A tell-tale sign that the counter-trend price action you’re seeing is a pullback, not a reversal, is low volume on the consolidation. This indicates that buyers are more aggressive and that sellers cannot overturn the trend.
Sign of Pullback: Trend Remains
Another sign that the counter-trend price action is just a pullback is if the trend levels are not violated. In other words, if the market is still making a series of higher highs and lower highs, and vice versa.
Sign of Reversal: Counter-Trend High or Low
A tell-tale sign of a reversal is when trend levels are violated. For example, if a lower low is made in an uptrend, that’s more likely to be a reversal than a pullback, especially if done on higher volume.
Sign of Reversal: Trend Climax
A trend reversal typically occurs after a significant impulse move in the direction of the trend called the trend climax. On the long side, this is the peak of buying interest, and price often gets overextended. At this point, there are no buyers left.
If after the climax, you see counter-trend price action with high volume, and a violation of the trend levels, it’s very likely that you’re experiencing a reversal.
Finding Trending Stocks That Are Pulling Back
The types of filters you use to find pullbacks will vary based on which tools you use. If you’re an active day trader, a real-time scanner like Trade-Ideas is ideal. In this case, instead of filtering for criteria, you get real-time alerts on price action that looks like a pullback.
Here are some criteria for stock screening, which is ideal for swing trading:
- ADX > 30
- Price > 20-day EMA
- Price < Keltner Upper Band (2.25 ATRs around 20-day EMA)
- 3-day RSI < 30
This will narrow down your choices of stocks which are in strong trends (high ADX), but are consolidating (between EMA and Keltner upper band), and are showing weak price action relative to the stock’s recent history (low 3-day RSI)
It’s important to note that we don’t recommend trading off of these indicator levels, but they serve as great filters to find stocks which might be setting up for a trend pullback trade. Remember, price action before all. Indicator levels don’t matter unless price action agrees with them.
Risk Management: Stop Placement
“Throughout my financial career, I have continually witnessed examples of other people that I have known being ruined by a failure to respect risk. If you don’t take a hard look at risk, it will take you.” – Larry Hite, hedge fund manager
Trading pullbacks is an imprecise game. The market is so noisy, especially nowadays with the diverse set of participants, that you must give a trade ample room to work.
There are pros and cons to the wideness of your stop and there are successful traders applying both philosophies.
In this type of trade, I consider a tight stop to be less than two ATR, and wider stop to be between two and four ATRs.
Tight Stop: Can Use Larger Size
If you follow a rules-based risk management system in which each trade risks an equal amount of capital, then your position size gets bigger as your stop gets tighter. In turn, you will experience larger wins.
Keep in mind that using a tighter stop doesn’t make the trade any lower risk, it simply skews the reward/risk ratio differently. By using a tighter stop, you’ll be shaken out of several winning trades.
Wide Stop: Won’t Miss Big Winners
This is the flipside to the previous point. The trader with a 1ATR stop will only take small losses and occasionally book some huge wins on larger size. However, he will also miss several big winners that took some time to develop and tested many levels before continuing the trend. Trend levels are imprecise and can swing a bit in one direction before the market does what you hypothesize it will.
Tight Stop: Never Take Big Losses
There is a certain psychological comfort in knowing you won’t have to take a big loss. Big losses can kill a trader’s confidence, especially an inexperienced trader. Those who haven’t developed a strong trading mindset yet may plan on some big losses happening, but lash out when they actually see the red letters in their P&L.
Wide Stop: Higher Win Rate
Using a tight stop will shake you out of several trades, hurting your win-rate. Sure, your long term expected value is really what matters but, we can’t deny our psychology. Losing often can hurt a trader’s confidence and make him second guess his strategy. This can lead to over-management of trades, tweaking a working strategy, or strategy abandonment all around.
Summary
We’re in an era of trading dominated by new technology, artificial intelligence, deep learning, and quants. Reading financial media, Twitter, and advertising copy pushes many to unnecessarily complicate their strategy, thinking it’s what they need to compete.
Trading psychology is still at play. Markets overextend and traders unload their positions, but there’s still institutions on the side of the trend, so it continues. Until the financial markets are so fragmented that large institutions no longer exist, pullback trading will have its place.
As we’ve shown you, pullback trading is profoundly simple and it works. Algorithms are deployed by humans, who are governed by emotion and often, faulty logic. The same market principles still apply.
There’s a quote often attributed to Leonardo da Vinci that says ”Simplicity is the ultimate sophistication” and we think applies to pullback trading.