

Meme stocks are back and yet again.
After months of commentators creating narratives that the retail phenomenon experienced in 2020 and 2021 was simply aberration, often citing exchange volume data as proof, have yet again been dashed as this small group of stocks like GameStop (GME), and AMC Entertainment (AMC) and a sub-group of related meme stocks continue to randomly pump on questionable catalysts.
More on meme stocks later.
Chart of the Week
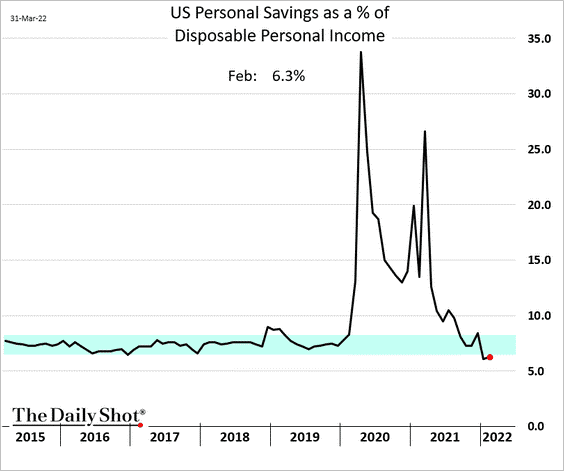
This week we look at US personal savings as a percentage of disposable income. Looks like a low float momentum stock gone bust:
Price Action This Week
We finally saw some weakness in stocks this week after several consecutive up days.

Image taken on Friday morning, so the last bar doesn’t reflect Friday’s price action fully.
This is quite typical price action, as indices like the S&P 500 are mean-reverting their nature, they don’t often remain at the edges of their short term range, as defined here by the Keltner Channels. It’s not oil or a microcap stock, so you can’t expect it to trade as such, with exponential trends and blow-off tops. Gains in stock indexes are more linear.
As of now, based on the limited information we have from this downswing, this looks like an orderly pullback within the context of a potentially newly formed trend. What will be most telling here is the nature of the pullback. If we get a relatively violent pullback, roughly defined as taking back roughly half of the gains established by the upswing, that bodes pretty negatively for the soundness of the trend.
In a newly formed trend, you’re looking for a strong initial few upswings with shallow and timid pullbacks, with the pullbacks getting more violent and the upswings getting more hesitant as the trend goes on until ultimately the pattern fails. If the first leg of the pullback is ugly, that’s not a trend you typically want to bet the farm on. We do have to keep in mind that we’re dealing with an index here, which are more mean-reverting than individual stocks as it relies on the performance of hundreds of stocks. Indices are always more choppy than their individual stock counterparts.
Oil Prices Backing Off, Biden’s Massive SPR Release
In oil news, US President Biden released 180 million barrels from the US’ Strategic Petroleum Reserve (SPR), a new record, at a rate of a million barrels/day over the next 180 days. Biden said that this is to put some ease on oil prices while domestic oil & gas producers ramp up production.
The price of front-month oil futures are testing the $100 level right now, after reaching a high of $130.50 earlier this month.

The SPR is basically a savings account full of physical oil that the US Department of Energy stores in case of emergency. Biden is releasing as much as he can as a result of the energy shortage.
Javier Goya on Twitter drew a projection of what the SPR would look like at the end of the release period:

Yield Curve Inverts
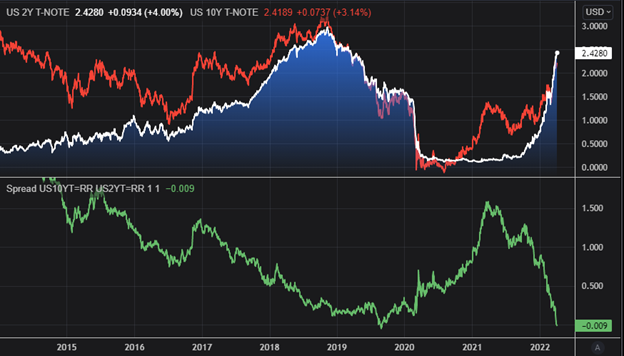
The spread between the 10-year and 2-year US treasury notes is one of the most reliable indicators of a recession. Typically, when the yield curve inverts (aka, you get more yield on short-term notes than long-term notes), the probability of a recession dramatically increases.
This is backwards, because under normal circumstances, longer-term loans carry more risk. More interest rate risk, inflation risk, default risk, and opportunity cost. Hence, longer-term bonds carry higher interest rates.
Hence, when this relationship breaks down, especially in the most important debt products in the world: US Treasury notes, something is wrong.
While there are many different US Treasury yield curves (different spreads between different maturities), the spread between the 10-year and 2-year is looked at as of the most importance.
And the yield curve inverted this week:
Meme Stocks Are Back… For Now?
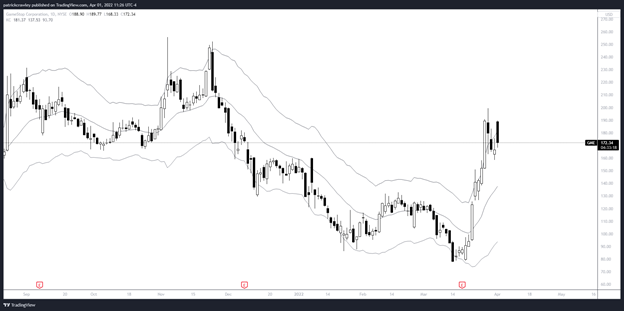
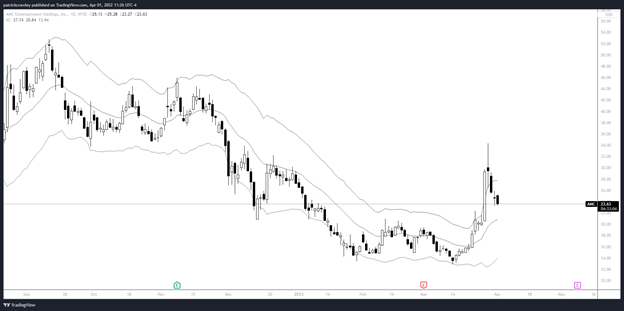
The “blue chip” meme stocks like GameStop (GME) and AMC Entertainment (AMC) are on the move this week. Amidst the new rally, GME capitalized on the rally even further by announcing a stock split. Tesla is also doing another stock split and issuing share dividends.
We know that a stock split does nothing to change the fundamental value of a company, but meme stock traders love stock splits. They view them as bullish catalysts and buy.
While many commentators are bemoaning retail reactions to stock splits, I think they’re missing the bigger picture which is a real driver of flows.
The average Robinhood account has $3500, versus their competitors with significantly larger averages exceeding $100,000.
Buying options on a $100+ stock is very expensive for such small accounts, and a loss would make up too large a portion of their account. Splitting the stock means cheaper options. Cheap OTM options means meme stock speculators can buy them without being too prohibitive to their account size.
And we know that retail OTM call buying has been a huge factor in many of the questionable rallies in growth and meme stocks throughout 2020 and 2021, as many have caught up on due to the growth in popularity of analyzing the hedging activity of options dealers and “gamma squeezes.”
So, purely from the standpoint of wanting to increase their stock price in the short-term, it makes complete sense for GameStop management to do.
Here’s charts of GameStop and AMC:
Anytime the “blue chip” meme stocks rally, there’s a number of sympathy plays, like:
- Newegg (NEGG)
- Avis (CAR)
- Robinhood (HOOD)
- Chewy (CHWY)
- Bed, Bath and Beyond (BBBY)
- Koss Audio (KOSS)
In Other News Last Week
- ISM PMI shows significant rise in input costs, decline in manufacturing sector (index reading: 57.1 vs 58.6 last month – below 50 suggests economic decline)
- Russia is still demanding payment for natural gas in Rubles or gold. Although, Russia’s deadline passed and gas is still flowing to Europe.
- Russia and Ukraine in ceasefire talks still
- US House began debating federal marijuana legislation this week
- More details in WarnerMedia/Discovery spinoff (stocks: DISCA, T)
- Nonfarm payrolls rose 431k vs 490k consensus
Earnings
Another soft week in the build-up to earnings season. So far, the early-reporting companies have mostly reported surprises. Next week (April 11) will be start of Q1 2021 earnings season and we should get a much better reading of how the economy is faring amidst rising inflation, energy costs, and geopolitical turmoil.
Here’s who’s reporting in the coming week:
Wednesday, April 6, 2022:
- RPM International (RPM)
- Schnitzer Steel (SCHN)
Thursday, April 7, 2022:
- Conagra (CAG)
- Constellation Brands (STZ)
Economic Data
Last week we got the all-important ISM PMI number, which is like a leading indicator for GDP. It declined month-over-month to 57.1 from 58.6 in February, and analysts expected month-over-month growth to 59.0.
Manufacturers mainly complained of the same old: the supply chain constraints, rising input costs, and labor shortages.
FYI, the survey portion of the PMI report is invaluable. Direct quotes from manufacturing executives. You can find the report here.
What else happened last week?
- The unemployment rate declined from 3.8% to 3.6%
Economic Data Coming Next Week:
Tuesday, April 5:
- S&P Global services PMI
- ISM Services PMI
Wednesday, April 6:
- Meeting minutes from the last Fed meeting
Thursday, April 7:
- Initial and continuing jobless claims