

Hope everyone had a great Memorial Day weekend. This is the unofficial start of summer, especially in the finance world, and typically marks an overall decrease in volume as Wall Street starts to split its focus between Fire Island, the Hamptons, and work.
Following the long weekend, we had a shortened trading week this week, marked chiefly by sideways price action, consolidating around what I like to call the “magnet” level of the 20-day moving average, where stocks tend to take a rest before beginning their next swing.
The dominant pattern in the S&P 500 is still a downtrend on the daily and weekly charts:
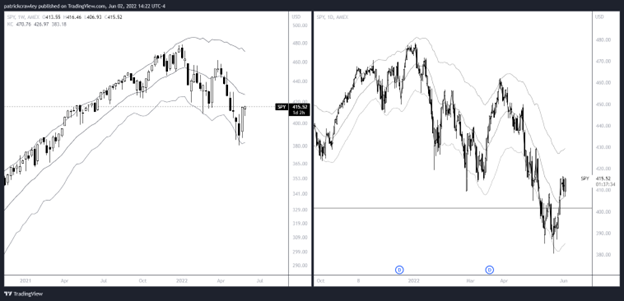
While we could easily view the recent bullish price action as a simple pullback within a larger downtrend, closer analysis warns us not to be so confident.
The reason being is that this pullback is more aggressive and momentous in nature than most high-probability pullbacks.
A downtrend is marked by a sustained power imbalance between the bulls and bears. Bears are in firm control, and the bulls simply aren’t motivated enough to put up enough of a fight to halt the trend.
However, this recent pullback displays conviction from the bulls, indicating that the bears aren’t entirely in control. And let’s face it, they seldom are when it comes to equity indexes.
For that reason, it’s hard to have much confidence in the current pattern.
To quantify this, see the modified MACD indicator on the chart below. This recent pullback registered a local high, in line with that registered during the previous upswing.
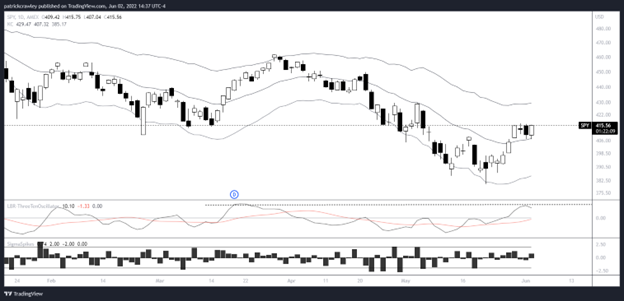
Furthermore, we have to be realistic about how relentless the upward drift in the US stock market is.
Whenever there’s a sustained drawdown like that of the present, I feel as if I’m on the edge of my seat waiting for the next all-time high print. After all, that’s been the path of least resistance for the last decade.
Moving to the oil market, the breakout setup that we talked about last week is beginning to trigger, and its ultimate success is still a question mark.
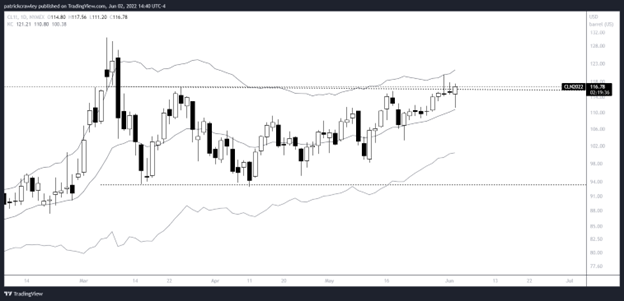
The price is sitting right around the breakout level, with larger wicks forming above and below the breakout level, indicating a level of uncertainty of where price will break next. This increased volatility is regular and expected within a breakout setup. After all, a breakout represents a sudden increase in activity, causing low liquidity, high volatility, and convex price moves.
Given the macro backdrop of poorly constrained supply, an unfriendly-to-energy government in Washington, and the cutoff of Russian oil, coupled with the price setup, it does look like the path of least resistance is to the upside.
Chart of the Week
There are no actionable trading insights from today’s chart.
Still, it displays a present economic reality that explains much of the work-from-home debate and why stories like Elon Musk cutting off WFH from Tesla workers are becoming such a breaking story.

There’s been a remarkable shift in the power dynamic between labor and capital, with labor getting the upper hand for the first time in some decades.
Last Week’s News
- JPMorgan CEO Jamie Dimon called the economy a “hurricane” which you “better brace yourself for,” indicating his bearish view on the US economy.
- COO Sheryl Sandberg stepped down from Meta (FB)
- The May ISM PMI report came in at 55, indicating a growing manufacturing sector. This indicator is viewed as a leading indicator for GDP, meaning the economy expanded in May.
- Salesforce (CRM) beat earnings expectations and rose 12%, bringing many of the cloud stocks with it.
- The White House is considering a proposal to tax “windfall profits” on oil & gas companies.
Earnings Next Week
With earnings season well behind us, the amount of companies reporting has slowed down. So how’d the overall market do in Q1 2022? Better than you’d think, given recent price action. If we were to annualize Q1’s numbers, earnings would grow 11%, and revenue would grow 13.5%.
But the market’s pretty much been going straight down despite this. So what gives? First off, inflation is a huge factor here. Those numbers stated above would have been great 3-4 years ago when we had 2% inflation. But with CPI north of 8%, these numbers are pretty paltry.
Furthermore, macroeconomic concerns have grown significantly with the Fed being forced to tighten into a contracting economy to fight inflation.
With that said, let’s take a look at who’s reporting this week:
Monday, June 6:
Tuesday, June 7:
- United Natural Foods (UNFI)
- Casey’s General Stores (CASY)
- JM Smucker (SJM)
- Academy Sports and Outdoors (ASO)
- Dave and Buster’s (PLAY)
Wednesday, June 8:
- Thor Industries (THO)
- Campbell Soup (CPB)
- ABM (ABM)
- Grief (GEF)
- Five Below (FIVE)
- Ollie’s Bargain Outlet (OLLI)
- Lovesac (LOVE)
Thursday, June 9:
Friday, June 10:
Economic Data Next Week
Last week we got an unexpected PMI number coming in at 55, indicating a growing economy. Anything above 50 means the economy is expanding. This number is at odds with the Fed’s Beige Book, which signaled contraction in many of their regions.
We have a few interesting points reporting next week:
Thursday, June 9:
- Initial and continuing jobless claims
Friday, June 10:
- Consumer price index (monthly)
- University of Michigan consumer sentiment