

By now, most people have heard about the blowup in various media stocks like Discovery (DISCA), Viacom (VIAC), and Tencent (TME). The financial media reports that a family office run by a Tiger Cub blew up due to its massive leveraged position in these stocks.
The story has been told ad nauseam.
The fund took massive leveraged positions in contracts-for-difference (CFDs) that the big investment banks underwrote. When Viacom did a secondary stock offering, the extremely clean uptrend was broken, causing huge losses for the fund.
When the losses took out the fund’s collateral, the banks were left holding the bag of billions of dollars worth of shares plummeting in value.
Bloomberg estimates that the portfolio lost 46% in just one week:

As a result of the massive leverage employed by the fund, the word is that they were left bankrupt, and the banks were stuck with a ton of exposure to a concentrated portfolio of stocks, which they were forced to liquidate quickly.
What Happened?
A large family office had been accumulating leveraged positions in several media stocks. At the first sign of trouble, the fund got a margin call, and the broker started selling the positions to retrieve their capital.
The catalyst for this seems to be Viacom’s secondary offering of stock on Monday, March 22 after the close. The news led the stock to gap down the next day, but pretty modestly given the recent volatility levels.
But things got worse before the open on Wednesday, March 24, when Viacom announced that they were pricing their secondary offering at $85. The stock went from a high of over $100 on Monday March 22 and closed at $70 by Wednesday–a 30% loss!

Social media reports indicate that the big banks like Goldman Sachs and Morgan Stanley were shopping around huge blocks of stocks like Discovery (DISCA) and Viacom (VIAC) at significant discounts to their market values.
The Stocks Affected
All of the affected stocks seem to be concentrated in the media sector or are Chinese growth names. Here’s the names that received the bloodbath of selling:
- Discovery Inc. (DISCA, DISCK, DISCB)
- ViacomCBS (VIAC, VIACA)
- Fox Corporation (FOX, FOXA)
- Baidu (BIDU)
- Tencent (TME)
- VipShop (VIPS)
Other names like Shopify (SHOP), and Farfetch (FTCH) are also reported to be part of the mass selling but didn’t receive as much of a beating.
Let’s look at some charts.
First, all of the names on one hourly line chart, with SPY marked in black as a reference point. Ouch.

Let’s take a look at the supposed catalyst for all of this: ViacomCBS (VIAC). They took the hardest beating too.

The next worst was Discovery (DISCA). The stock exhibited nearly the same exact pattern on the way up as Viacom, making it nearly as bloody.

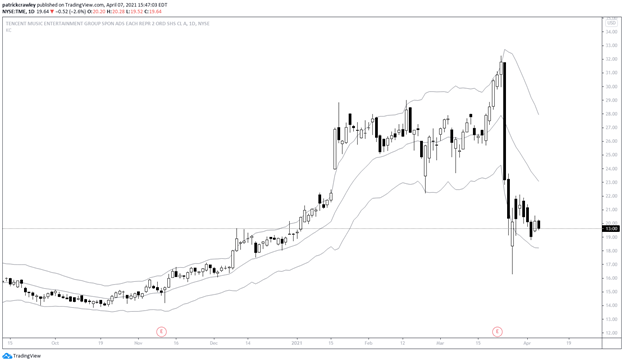
The next worst-hit stock was Tencent, which is the largest company of the bunch.
How Much Leverage Was Used?
There’s lots of speculation flying around about this matter with little in the way of verifiable facts. The fund was a family office, meaning they don’t have clients and thus don’t send out investor letters to clients.
Plenty of blog posts from smart people like Kevin Muir of The Macro Tourist estimate that the fund’s leverage ratio was around 5:1, and with other estimations as high as 8:1.
Momentum Stair Step Patterns
I’ve been watching Discovery (DISCA) for a few months because of how strong and one-sided the buying was. The chart was beautiful for those who already established positions and maddening for prospective buyers.
There were no pullbacks or lulls in the trend by which to enter with an easily definable risk point.
These are very specific types of trading patterns that are difficult to deal with.
They’re not like your usual strong momentum stocks that make a large momentum burst, consolidate a bit, make another burst, consolidate, make a very large burst, then consolidate for long enough that people get bored, then continue their trend upwards.
These types of stocks move in a straight line on one side of the market, often without the volatility that accompanies a strong trend.
And what happens is that the longs in these stocks start trailing their stops tighter and tighter. After a dozen up days in a row outside of a trading channel like Bollinger Bands or Keltner Channels, everyone knows that a pullback is imminent.
But that doesn’t happen, and it continues in a straight line. So long that the stops are so tight and concentrated just below the recent lows (which tends to be the previous day’s low because there are no “swings” in these stocks) that everyone rushes for the exit at the first sign of a pullback.
Pundit Hand Waving
While the fund in question played a huge role on both sides (pushing the stocks up and down) of the market, let’s not discount other traders’ role. Markets have memories.
When a stock marches up in one direction for several months, making you a few percent per day, it’s easy just to project similar price action into the future.
No doubt, there were tons of momentum traders and algorithms crowded into these stocks at the top. For many of these traders, that first gap down in VIAC is an exit signal. If not then, then their stop wasn’t far away.
Stops were likely clustered just under recent lows and added to the mayhem.
After occurrences like these, pundits love to decry traders that just buy what’s going up, without regard for the long-term fundamental value. They decry short-term stock market profits, claiming it adds nothing to the system.
It’s true that between the banks and momentum traders bailing out and taking all of the liquidity, there wasn’t much room for the average investor to sell without a large loss. But that only looks at one side of the coin.
We can’t forget that trading isn’t all about trend following. Many traders make their living by providing liquidity on the way down.
They’re mean reversion traders buying big positions in these stocks right now because their models say a bounce is more likely than not.
The Share Class Convergence Trade Gone Wrong
A lot of these media stocks have multiple share classes. Most of the time, the only difference is the number of votes per share you get. Most of the time, the spreads between these stocks have remained relatively narrow.
But it’s a whole different story with the different share classes of Discovery’s stock.
This does happen when significant moves are made in the stock because the short-term traders favor the more liquid class of stock and the arbs don’t want to step in front of the momentum train.
But in this case, the spread between the share classes look like stock charts themselves, specifically on Discovery.
A little info on the Discovery share classes. They have three classes: A, B, and K. The voting stack goes like this:
- DISCA: Class A shares get one vote per share
- DISCB: Class B shares get ten votes per share
- DISCK: Class C shares get no votes
DISCA and DISCK are the active shares, while DISCB is quite illiquid and mostly owned by insiders. Here’s the outstanding shares breakdown for each class:
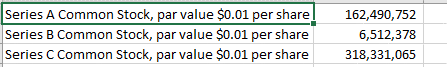
As you can see, there are a small fraction of Class B shares outstanding compared to the other classes.
So why are we talking about this?
Because it looks like some hedge funds probably blew up putting this share class spread. And this isn’t the first time there’s been a massive blowup in the Discovery share class arbitrage trade.
Before we go on, let’s briefly discuss share class arbitrage. Some companies issue multiple classes of stock. Most of the time there are differences like the number of votes each share gets, while other times there are no distinct differences.
Because markets aren’t perfect, the two classes of shares often trade at different prices. This could be because one share class is more liquid, demanding a liquidity premium so investors can easily get in and out without slippage.
It could be because the market is putting a premium on a vote. Or it could just be random price fluctuations.
This, of course, creates an arbitrage opportunity. You have two securities, each representing virtually the same asset, trading at different prices. This is the classic arbitrage that economics professors claims do not exist.
The natural reaction is to sell the expensive one and buy the cheaper one and just wait for the spread to narrow. However, you’ll see that there are natural “limits to arbitrage” as academics call it.
The first is that usually the spread between the two shares is pretty narrow, meaning that you’d have to use a lot of leverage to magnify the gains. This immediately causes a problem though, because while this trade is “theoretically risk-free,” that couldn’t be farther from the reality.
Before we bring in any real-life examples, consider this: if the spread is out of whack now, why couldn’t it get further out of whack? The spread won’t magically close because you decided to put on the trade.
There are other frictions too. If you’re shorting the illiquid share, you might not be able to get a locate, or the borrow rate might be high, cutting into your profits.
Then there’s the execution risk. If one side of the trade is illiquid, it’ll be pretty hard to get filled without crossing the spread.
So you can see there are plenty of frictions that can lead to these share class spreads remaining out of whack for extended periods. But there are still traders that put these trades on.
Amid all of the chaos created by these forced liquidations in Discovery, the spreads between the share classes got all mixed up.
The different classes of Discovery already have a history acting quite wonky compared to the calmer spreads like those of the two classes of Royal Dutch Shell (RDS.A and RDS.B), or Berkshire Hathaway (BRK.A and BRK.B).
During the March 2020 market crash, the liquid classes of Discovery plummeted while the illiquid class (DISCB) spiked.
So here’s what happened to the different classes of Discovery stock. We’ll start with a weekly line chart with all three classes overlaid.
There’s arrows at points where DISCB was negatively correlated with DISCA and DISCK, indicating that someone was forced to liquidate their spread trade (short DISCB and long either DISCA or DISCK).
- DISCA: Blue line
- DISCK: Black line
- DISCB: Red line

You can see how extreme the price discrepancy was.
Let’s now look at the recent price action of DISCA overlaid on that of DISCB. The black and white candles are DISCB, while the red and green candles are DISCA.

As mentioned, because the spreads between shares classes is often relatively small and in order to magnify the gains on these trades, funds will often employ leverage. Their thinking goes, that because the theoretical risk of a pairs trade between nearly identical securities is low, allowing them to justify taking more risk.
But markets are clearly not that efficient and most of the time they don’t fit the assumptions of models.
Hence, sometimes we have really weird things happen due to liquidity constraints, risk management, psychology, and share structure that rear their head in what theoretically “should” be an easy trade.
Bottom Line
This incident has endless threads to follow, many of which aren’t covered in this article.
One of the major questions financial commentators are asking is about the banks. There are reports emerging that the prime brokerage departments at many banks lost billions of dollars trying to unwind their positions in affected stocks.
Some experts are saying that this event will lead to deleveraging across the prime brokerage business, leading to all sorts of implications for their leveraged clients.