

The basic idea behind a pullback trade is to try to enter a strong established trend on short-term weakness, hoping the trend will continue after some momentary hiccups.
Trend trading is a well-accepted trading strategy across all time frames.
Institutions sell trend-following products to their clients to ride trends across several months or years, while intraday traders aim to capture trends as short as a few minutes or a few hours.
What is a Pullback?
Pullback is such an overused term in finance that I should define what I mean when I say “pullback.” I’m referring to short-term weakness in a strong, orderly trend.
Oftentimes you’ll hear a CNBC anchor say that he’s “buying the pullback” in a range-bound stock.
That’s not what I mean, in order for a pullback opportunity to be present, there must be an obvious price trend present.
Here’s a few quick Microsoft Paint sketches of a pullback:
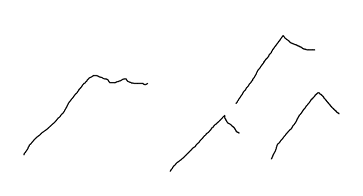
Because the market exhibits tons of randomness and chaos, most pullback setups look a little different. Some consolidate into a tight range near the recent highs, while others will sell off a bit more creating a new “downswing.”
What is VWAP?
VWAP is the volume-weighted average price over a time period. If you added up every share, multiplied it by the price paid for it, then divided that number by the total volume for the session, you’d get the session VWAP.
But don’t worry too much about calculations for now, the important concept to remember is that you can think of VWAP as the average price paid for a share throughout the trading session.
VWAP is used heavily in the institutional trading world, mostly as a measure of a trader or algorithms performance. If a large order got an average price below the VWAP for the life of that order, the order performed well, and vice versa.
This is significant enough, as it’s clear that the largest traders are paying attention to the VWAP and making trading decisions based on it. However, many traders don’t take the additional step in understanding how institutions truly utilize VWAP.
These institutions don’t throw the regular session VWAP on their chart as you would and judge based on that, but instead, they judge order performance based on the VWAP over the life of the order.
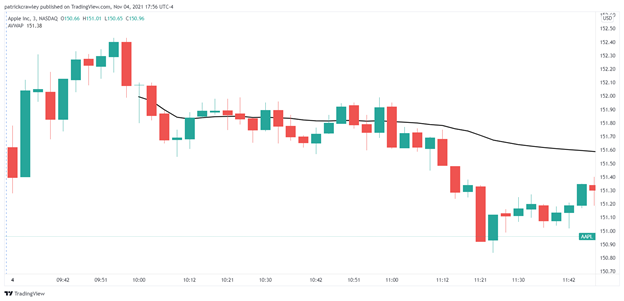
In other words, if an execution trader started buying stock at 10:00AM and finished the order by 10:30AM, only the VWAP during that half hour would be used to judge the order. In other words, they might use an anchored VWAP to visually represent this concept.
Pictured: VWAP anchored to 10:00 AM EST on November 4, 2021 in AAPL.
On the other hand, many self-directed day traders swear by VWAP.
Some use it as a moving average, looking to trade in the direction of the trend, while others use it as a red light/green light trend indicator, something like: if the buyers defend an uptrend at the VWAP, then that is a strong trend.
The Requirements for a VWAP Pullback Setup
Strong Trend
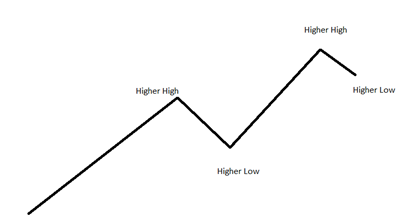
The basic way to define a trend is a series higher highs and higher lows, as such:

Without forming this famous “ABCD” pattern, you don’t have a trend. No moving average or technical oscillator can say otherwise, because this is the base definition of a stock trend.
But if trend trading was as easy as identifying such formations, you’d be on a yacht from your trading profits and not reading this article.
So it’s obvious there are nuances to trend trading. Particularly, those nuances are:
- Trend termination
- Whipsaws
Trend termination refers to the end of a trend. Many times, you’ll buy a pullback in a trend, only for the stock to decline past the pullback point and breach the previous higher low, which ends the trend. This happens to any trend trader with regularity.
There’s no getting around it. But one of the main differences between good and bad trend traders is the ability to read between the lines and avoid some of those pullback failures.
Whipsaws mostly come down to the stop placement. If you like placing really tight stop losses, you will be whipsawed out of many more trends, but your losses will be smaller.
If you give your trades more room to breathe with wider stops, you’ll miss far fewer trades, but have larger, less frequent losses.
It all comes down to striking an efficient balance between these two. While there’s no right answer, there are some wrong answers. A bad example of a wide stop loss would be the following (with your hypothetical entry marked by the black arrow):
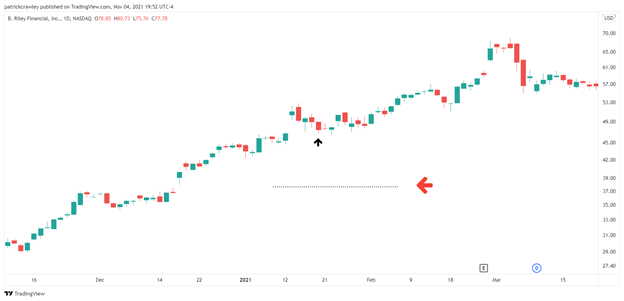
The stop is far below the previous higher low, a significant breach of which would already render the trend mostly over, so your placing of the stop this far away doesn’t really have any added benefit, it only hurts you.
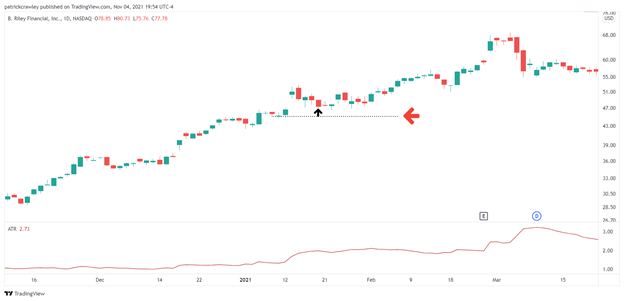
Conversely, here’s an example of a stop so tight that you’re not giving the trade any room to breathe. If things don’t go 100% as planned, you’ll be stopped out of the trade:
Strong trends are usually marked by a lack of indecision in the market. That’s a series of large body directional candles with small wicks, like Marubozus:
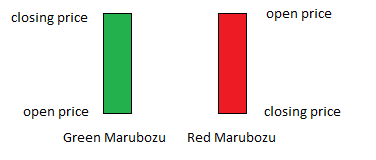
When you start seeing very large wicks (or shadows) on candles, that can indicate indecision entering the market; that the bulls are losing complete control of the market:

Orderly Pullback
All pullbacks aren’t created equal. Some are aggressive, some are timid. There’s nuances that we simply can’t get into in this relatively short article, but the main concept to keep in mind with a pullback is that a good pullback setup is “hesitant.” The market has gotten ahead itself and needs to let off some steam.
A bad pullback is an aggressive rejection of the high prices, with the bears rapidly pushing the price down.
Keep in mind the textbook pullback pattern:
Here’s an example of a pretty textbook pullback pattern, but note that it’s not perfect. There’s an pretty ugly red candle in there, but overall, the pullback was far more tame than the upswing, which is what we’re looking for:

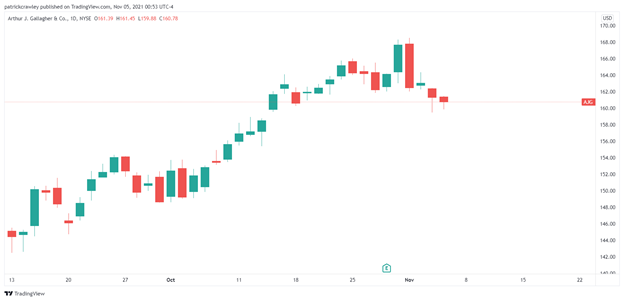
On the other hand, here’s a situation in Arthur J. Gallagher (AJG). The stock is in a strong uptrend and appears to be pulling back. However, observe the behavior near the highs. There’s significant price rejection at the highs, marked by that huge red Marubozu candlestick.
This type of pullback has a higher likelihood of failing because the bears took control and created a turning point.
Trend Not Losing Momentum
A trend represents a sustained imbalance between supply and demand. For an ongoing period, the bulls were much more aggressive than the bears in their accumulation of stock, which forced sellers to gradually raise their offers over time, creating a price trend.
For a trend to persist, it needs to maintain that level of imbalance, meaning there needs to be a pressing reason to buy the stock. There needs to be momentum: an accelerated level of pace on one side of the market.
Or else, the train loses steam, the market gets bored, the stock consolidates into a range until it makes its next move.
One way to measure momentum is with technical indicators. You can use simple statistical tools like regression lines, however, all of them really tell you the same thing: how fast price is moving in one direction relative to its price history.
The MACD and ADX (Average Directional Index) are two such tools that can easily quantify momentum.
However, you can’t view momentum in a vacuum. Momentum must be compared to itself. In other words, you need to compare the momentum present in this current “swing” or “leg” of the trend to the previous legs. If the momentum is waning out, that’s a dying trend. If the momentum is on par or in excess of previous swings, the trend is still strong.
Technical traders call this concept momentum convergence and divergence. Convergence is when both the new high in price agrees with a new high in momentum, and divergence is when the two disagree, like when there’s a new high in price unaccompanied by a new high in momentum.
Not At a Blow-Off Top
One of the more reliable, but difficult to exploit patterns in stock trends is the eventual failure of the blow-off top. The blow-off top is an explosion of energy in the direction of the trend, typically expanding the average candlestick multi-fold.
These patterns are all around us nowadays in this age of meme stocks. Just look at the past rallies in GameStop, Bed Bath & Beyond, Avis, and all of the other popular meme stocks.
Here’s a textbook example in GameStop (GME) from January 2021:
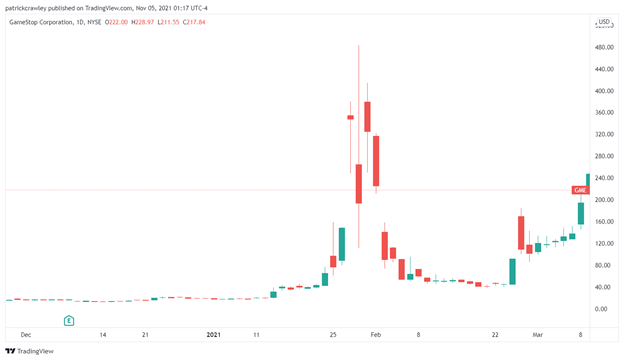
Notice the indecision? Candles with massive range and huge wicks (shadows) with no discernable direction.
These stocks are simply advancing at such an unsustainable rate with such a high level of emotion, FOMO, and panic that the rally virtually has to be short-lived.
Typically, the best way to play these is to not play at all. Some traders try to get smart by shorting these stocks, but these are account-killing trades, a situation with asymmetric risk:reward against you.
How To Use VWAP in a Pullback Trade
Now that you’re well acquainted with some of the tricks of the trade, it’s time to talk about VWAP.
How to Set Up VWAP on Your Charts
As we’ve established, all trends are different. Some are runaway trains, others are more tame and orderly. As such, you need to apply different tools for different tools.
The best method of utilizing VWAP is by plotting one and two standard deviation bands around the VWAP.

Don’t Treat VWAP as Gospel
Perhaps one of the most glaring problems that novice traders make is treating technical indicators as gospel. At the end of the day, an indicator is just a calculation based on price and volume.
It’s a tool to help you put price action into context, but all of the information within any indicator is already on the price chart.
An example of how people mess up here is when they think of a “VWAP pullback” they hyper-focus on the exact price that VWAP is at, and won’t buy the stock at any other price.
Again, it’s a calculation. If you switch to another charting platform that has a slightly different technical indicator, the VWAP might be a few cents different.
Identifying Stage One and Stage Two Trends
When using VWAP to trade trend pullbacks intraday, I like to divide tradable trends into types: stage one and stage two. Stage One trends are typical and orderly.
You’ll see them in Dow components like Coca-Cola (KO) regularly intraday. Stage Two trends are like runaway trains. You’ll see them in the hot stocks of the week like Tilray, Tesla, etc. These involve extreme range expansion.
The primary difference between these two is how to use the VWAP with them.
Stage One trends tend to pull back to the VWAP line with much more regularity, while Stage Two trends typically don’t come back to VWAP until the trend is already losing steam, so your best pullback opportunities will occur at the 1 standard deviation line.
Bottom Line
Using VWAP in trend trading isn’t much different than using Bollinger Bands, moving averages, Keltner Channels, or any other technical indicator. They’re simply visual tools to help us put price action into context.
They serve as rough ‘average’ points at which we want to enter a pullback and nothing more.
The core concepts behind trend trading and identifying good pullback candidates are far more important and can be readily applied with any trend indicator of your choice.