

The variable of volume in the stock market (or any market with fixed supply) is arguably the most essential piece of technical information available to traders, especially day traders.
The reason that volume is so important is because volume shows the conviction of the participants. Volume tells us what people want and how much or little they want it. Volume creates opportunity.
The study of volume is often delineated between two types of measurements Volume Price Analysis and Volume At Price Analysis. Volume Price Analysis (VPA) is measured vertically and over a specific period.
The most well-known example of VPA would be the regular volume bars on a Japanese candlestick chart or American bar chart. Another type of VPA would be the popular moving average known as the Volume Weighted Average Price (VWAP) indicator.
Volume-At-Price Analysis (VAP) measures the amount of volume traded at a particular price level. VAP is a more advanced form of technical and volume analysis, and day traders most commonly use it. VAP helps identify what prices have traded the most and where equilibrium is established. Standard tools used to measure and interpret VAP is Market Profile and Volume Profile.
Believe it or not, some people commit themselves to the idea that one form of volume analysis is better than the other. Traditional long term investors and swing traders in the stock market would more than likely argue that vertical representations of volume in Volume Price Analysis are more critical.
Day traders could argue that Market Profile with Time Price Opportunity in Volume At Price Analysis is more important.
Regardless of your time frame of investing or trading, we don’t have to decide over VAP or VPA. VPA and VAP are not opposites or competitors. They are complementary to one another. And combining both VAP and VPA creates powerful forms of analysis for the day trader.
For those of you familiar with Order Flow Analysis, this article may be of special interest to you.
Integration of VAP and Volume Price Analysis
Volume Imprint is a type of volume tool that integrates both VAP and VPA. In a nutshell, Volume Imprint shows the distribution of volume inside a candle or time frame. Volume Imprint itself is a collection of various tools to analyze volume. Many of the separate tools that we would use to analyze VAP and VPA separately are used together in Volume Imprint.
With the Volume Imprint tool, we can represent volume with the Volume Profile, Delta, basic Volume, Ladder, or Bid/Ask. The image below is my default setup for Volume Imprint, ladder:

The chart above probably looks weird. And confusing. First, let’s identify the main components of this volume study:

Numbers 1 and 2 are both represent two sides of a ladder – this particular Volume Imprint is represented as a ladder. Number 1 represents the one-hour candlestick with the volume ladder on it.
Number 2 displays the ladder for the entire trading day/session. Below are summaries of the candlestick above it. Currently, number 3 is displaying Volume, the Cumulative Delta, and the AVAP, but other volume measurements can be added.
Breaking down the Ladder in Volume Imprint
For day trading, the stock market, and individual high volume stocks or ETFs, few things come as close to cheating as the Ladder option with the Volume Imprint tool. Each candlestick with the Ladder profile on it represents a kind of DOM.
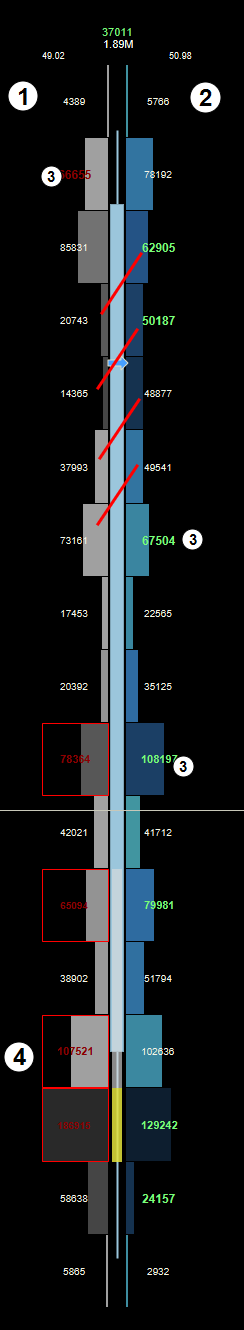
Number 1 represents the Bid column, and Number 2 repents the Ask column. A standard error people make is comparing the numbers of the bid and ask from left to right, but that is incorrect. The small diagonal red dashes show how you should read the volume, it is from left to right but diagonally.
The number 3s show numbers that have highlighted numbers in either dark red or neon green. The numbers change color if a certain threshold has been met to create an imbalance. You can adjust what is considered imbalance, but I have my settings for imbalance set at 150%, 200%, and 300%. What this means is that if the Bid volume is every 150% or higher than the Ask volume, the Bid volume will turn red – and the fonts will increase size as the imbalance percentage grows.
For example, the number 3 that is next to the green Ask volume of 108197, which is compared to the Bid volume of 42021. Because 108197 is +157% of the Bid’s volume, the number turns neon green.
Number 4 shows a red box surrounding the Bid value of 107521. A highlighted box around a Bid or Ask number displays absorption. When we see absorption presented with a box, that is a powerful piece of data that warrants some attention.
If we look at number 4, we can see two boxes of absorption at the Bid. What we’re looking at is a condition where a whole bunch of sellers hit the Bid (selling into the Bid) with very high volume, but no follow through with prices moving lower.
Instead, price paused and then started moving higher. That is an example of absorption – it’s a price and volume level where a substantial amount of volume fails to push price in the intended direction.
A walkthrough with Volume Imprint

Microsoft’s (MSFT) chart above is a one-hour Volume Imprint ladder profile. I want to call your attention to two values that appear above or below the candlestick. The white number represents the total volume traded in that candle while the green or red number represents the delta. The delta tells us how much of a difference there was in buying volume and selling volume.
Additionally, look for any highlighted red or green boxes that highlight buying and selling absorption, see letters A and B. When we see the buying absorption on the charts at A and B, we need to observe what happened with price when the buyers were absorbed and count trade any higher.
What happened? Price dropped. The exact inverse of that situation occurred when selling absorption occurred – prices moved higher.
Being able to identify absorption levels is a huge advantage that you will have over other traders. If price is trading at or near an important area of resistance and we see buying absorption occurring near that resistance, there is a very high probability of prices falling.
Why? Because the buying absorption helps to confirm the resistance level by stopping any higher prices. But we need not be limited to just horizontal levels of support and resistance. Other tools can also be used, like below:

Look at the candlestick and Volume Imprint ladder at letter A. The two indicators on the chart (besides Volume Imprint) are the VWAP (Volume Weighted Average Price) and the Bolling Bands.
The VWAP is an extremely useful tool when using volume as a primary analytical tool because the VWAP takes into account the measure of volume at traded price levels over an established period of time.
The Bollinger Bands are a volatility indicator. If we look at the close of the candlestick at A, we can see the candle closed above both the VWAP and the lower band of the Bollinger Bands.
When we see price moving towards VWAP and the lower band of the Bollinger Band, we should look at the Volume Imprint of the current candlestick. If we want prices to move higher, what kind of conditions should be met with the Volume Imprint? We want to see a large amount of buying volume, but, most important, we want to see some seller absorption.
Seller absorption is key to confirming that the short side of the market has been exhausted. We see that very clearly with the massive 230k selling absorption at the Bid compared to the much smaller 69k at the Ask. This provides some early warning to traders that prices will have a much easier time to move higher.
And we can see a big struggle continue to try and short the market if we look at the next candlestick. Again, we see massive selling absorption directly above the VWAP and Bollinger Bands with massive buying volume support price higher.
Final Thoughts – Volume Price Analysis
Knowing the market you trade is extremely important and having the right tools for that market is essential. For markets with fixed volumes like the stock market, having a powerful volume-based toolset is necessary.
A combination of time and volume can create powerful pieces of data for the trader. While it is easy to fall into a bias of wanting to use one form of volume analysis over the other, it is important to understand that nearly all of volume analysis is useful in helping to complimenting each other.
The strength of combining volume measurements over periods of time charts like Japanese candlesticks with the measurement of time at a particular price level (such as Market Profile) creates a powerful analytical tool.
When used in conjunction with other tools in our trading toolbox, the combination of VAP and VPA with the Volume Imprint tool can give traders a distinct advantage.