

The shooting star pattern is a reversal candlestick pattern. At its core, the shooting star is a failed breakout or “fake out” pattern.
Trading this strategy aims to take advantage of the fact that most breakouts fail, and helps you identify some clues of a breakout with a high probability of failure.
Throughout this article, we will:
- Explain both the shooting star pattern and candlestick
- Show textbook examples of this pattern
- Explain what makes this pattern work
The shooting star candlestick is defined by a small body and a long upper shadow, with the shadow typically being at least twice the size of the body.
The ‘story’ of this candlestick is a push to new highs, which is staunchly and quickly rejected. Usually, price hits the new high intraday and quickly sells off from there.
This pattern is identical to the inverted hammer pattern, but the inverted hammer pattern looks the below candlestick in a downtrend.
Here’s an example of the candlestick itself:

Examples
Here is an example of a Shooting Star Pattern:
While those who took this trade certainly had mixed results based on their exit strategy (the market rallied just days after the price drop), this setup had several things going for it:
- The prevailing trend was downward, but the push to highs occurred during a short-term uptrend.
- The stock had trouble breaching the high multiple times before the shooting star candlestick.
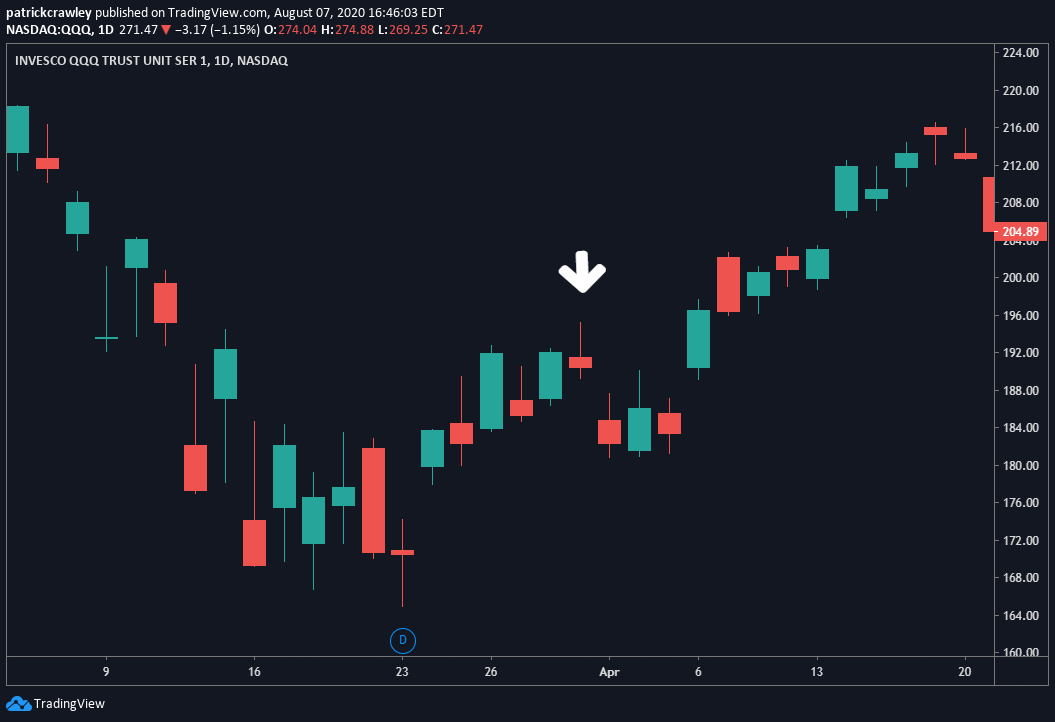
Here is a bad example of a Shooting Star Pattern:

While the above chart of DocuSign (NASDAQ:DOCU) technically meets the definition of a shooting star pattern, this is one of the worst examples.
Situations like these are typically where newer traders get into trouble; they know how to identify a pattern, but don’t know how to analyze the market structure around to decide if the trade is high-probability.
In the next section of this article, we’ll review how to analyze the market structure and context of a trading pattern.
Performance of the Shooting Star Pattern
Candlestick patterns are often in the eye of the beholder. What is a shooting star to some, may not be to others. Thus, it’s challenging to backtest these patterns, primarily when you rely on a computer to identify the patterns.
Programmatic pattern identification doesn’t know the context and probably spits out several false positives.
However, if there’s one person that is best for the job, it’s chart pattern expert Thomas Bulkowski, author of Encyclopedia of Chart Patterns.
In his backtesting of the pattern on daily charts, he found a success rate of 59%, which he considers “near random.”
What Type of Pattern is the Shooting Star?
The shooting star pattern can be a failed breakout or trend termination/reversal pattern, depending on the structure of the trend and preferred risk/reward ratios.
The shooting star pattern has no real official definition, and its utility is more in the beholder’s eyes. It’s a catchall term for reversal-style trading patterns catalyzed by the shooting star candlestick.
This is why it’s essential to define your preferred risk/reward when trading such patterns.
The pattern is of the trend termination variety when you’re looking to benefit from an actual reversal of the trend.
This means you’re not only looking for a significant initial counter-trend move when the breakout fails but for a new, opposite-direction trend to begin afterward.
It becomes a failed breakout or ‘fake out’ pattern when you’re not looking for a trend reversal, but just one counter-trend swing downward when the breakout fails.
These two distinctions are important because they dictate which risk/reward profile to apply.
Trend reversals have low win-rates, but the few winning trades are typically home runs. Winning at these patterns comes in managing several small losses and ensuring you’re aboard the train long enough when the big wins come.
The profit structure of a failed breakout pattern, on the other hand, is almost opposite to the reversal pattern. Because of the pattern’s high probability of winning, losses are generally frequent but small, with more substantial and infrequent losses.
The difficulty in managing this risk/reward profile comes typically from managing the losing trades surgically by cutting losses quickly.
Keep in mind that, depending on the risk/reward profile you choose, your trade selection should also change.
The probability of a failed breakout and trend reversal is different, and this should be taken into account before executing any trades.
A Word on Failed Breakout Patterns
Unless you’re an experienced trend reversal trader, I think it makes sense to focus your energies on fading failed breakouts when trading this pattern.
Entry and exit signals are more cut-and-dried, and the win-rate is better for your trading psychology as a budding trader. This, however, doesn’t mean this pattern is easy.
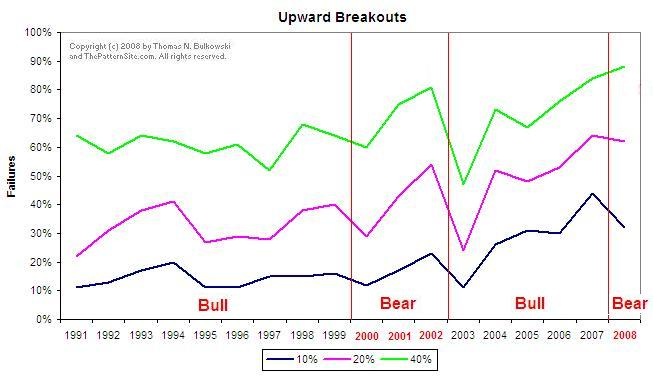
Nevertheless, here’s why failed breakout patterns work: most breakouts fail. And since the dot-com bubble, their failure rates have increased.
Markets are complex, and explanations for changes within are typically multivariate, but common sense probably explains this trend. With the rise of online, self-directed investing, retail traders read about breakouts in trading books and began to crowd the trades.
When a breakout is crowded with fly-by-night, emotional retail traders, it makes sense that nowadays, breakouts have a higher failure rate.
Below is a graph published by Thomas Bulkowski, mentioned earlier, author of several excellent books on chart patterns, chief among them is his Encyclopedia of Chart Patterns.
Bulkowski tracked the success rate of breakout trades for roughly 18 years and found that most breakouts fail to produce substantial results.
Shooting Star Pattern: Green Flags
If all profitable trading required was seeking out the correct candlestick patterns and trading them surgically, humans wouldn’t be able to profit from them.
It’s simple for computers to identify these patterns but, you’ll notice there are no HFT funds making billions just trading candlestick patterns all day.
What will actually set you apart in terms of profitability when trading candlestick and chart patterns is identifying the context and market structure surrounding it.
Successful iterations of these patterns leave clues of their success, as do the failures.
Momentum Weakening
One of the key factors which allow uptrending securities to make new highs continually is momentum.
Put simply; momentum is consistent unmatched aggressiveness from one side of the market. When a stock has upside momentum, the number of buyers increases, and their desire to buy the stock at any price increases.
We can identify momentum using several factors, and chief among them is simple candlestick analysis. But, we can also use level 2 data and technical indicators.
When trading the shooting star pattern, we want to look for declining momentum leading into the formation of the shooting star candlestick itself.
Among other things, we are looking for:
- Pullbacks from the uptrend are getting steeper and lasting longer.
- Stock is making new highs less often.
- Price increases are getting tamer
Low Volume on Breakout
Volume equals interest. Low volume on a breakout significantly reduces the odds of that breakout’s success.
The ideal scenario when trading shooting star patterns is that the breakout will occur on low or average volume.
More successful breakouts typically create volume of at least 50% above the volume’s 10-day moving average.
Time Frame Divergence
One of the strongest tailwinds in your favor when trading the shooting star pattern is a time frame divergence. The weekly chart in a strong downtrend, while the daily is in a short-term uptrend, is a great example.
As a rule of thumb, when there’s a time frame divergence, the higher time frame is more predictive. The higher the time frame, the larger the supply/demand shifts.
Look at it this way, is a trend 5-minute chart or monthly chart more significant? Of course, these are generalities, because all burgeoning trends drop their first breadcrumbs on lower time frames.
Still, trading is about putting probabilities in your favor, not seeking out outliers from the mean.
An ideal scenario is when a down-trending weekly chart is amidst a pullback to the upside, which generally shows up as a short-term uptrend on the daily chart.
So long as the trend doesn’t exhibit any red flags (inverse the green flags laid out in this article), a shooting star pattern’s probability benefits.
Watch The Pullbacks
Analyzing each swing of a trend delivers a deeper understanding of how a trend is developing (or slowing down) than always relying on technical indicators and purely quantitative solutions.
Of course, indicators are immensely useful, but they lag price action.
One of the critical factors in the success of a shooting star pattern is your observations of the trend’s pullbacks.
The strongest, healthiest trend pullbacks have:
- Low volume
- Narrow ranges
- Shallow pullback from recent swing high
Pullbacks that are indicative of a trend in trouble have:
- Higher volume (observe the 10-day volume moving average)
- Higher volatility and increased interest from traders
- Deeper pullback from swing high with longer candle wicks.
When analyzing the trend of a potential shooting star trade, you want to see the trend deteriorating, with each pullback exhibiting more and more traits from the second list above.
Bottom Line
Trading patterns are seldom that profitable if followed robotically. Patterns serve us better when we use them as clues to potential exploits of market psychology.
For instance, today, we talked in detail about the shooting star pattern, but this specific sequence is just one way to trade a failed breakout or trend reversal.
Patterns also help us compartmentalize our trading mind too.
Traders, especially, being on the computer so often, are so susceptible to distraction on the internet. Many of us listen to several podcasts and read books from traders with entirely different approaches.
All of the sometimes contradictory information and advice sometimes just serves to confuse.
When we allow ourselves to “just focus on finding the pattern,” it becomes much easier to focus and perform individual analysis on that pattern.
In summary:
- The shooting star pattern is a bearish pattern that aims to get short when a market rejects a new swing high within a weakening uptrend.
- If traded incorrectly, you can end up on the wrong side of a breakout.
- Analyzing the structure of the trend leading up to the shooting star candlestick is pivotal to your success in trading this pattern.