

The best swing trading indicators can differ for each trader but the ones we mention in this article have worked for us and are the ones we use.
Swing Trading Intro
There’s no exact definition of swing trading, but traders typically define it as a trade lasting more than a day and less than a month. Swing traders tend to have different goals than day traders, which aim to pick up on quick intraday moves due to a catalyst.
Swing trades, on the other hand, tend to aim for “swings” moving from a short-term low back to a recent high (on the long side).
Swing trading signals tend to look different than day trading signals. Day traders often look for high volume and volatility and look to ride a trend, perhaps buying at a pullback to VWAP.
Swing traders will consider other factors like a stock’s strength compared to the broad market, or what the multi-day market structure looks like.
In this article, we’ll shed light on some of the best swing trading indicators.
Relative Strength Index (RSI)
Welles Wilder developed the RSI indicator in the 1970s and published his findings in New Concepts in Technical Trading Systems. The book is a classic text which introduced multiple conventional technical indicators like RSI, Average True Range, and the Average Directional Index.
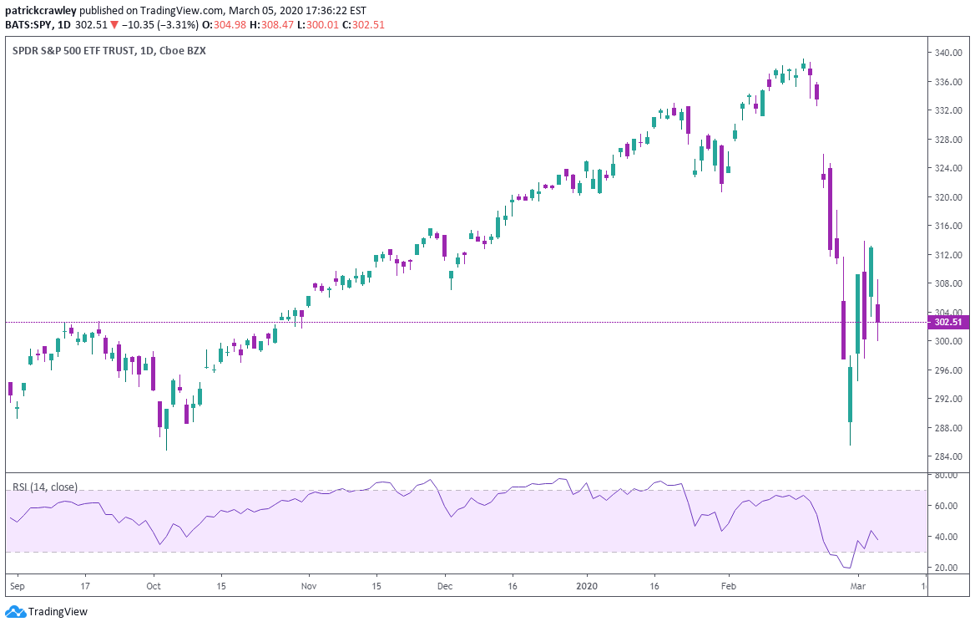
Chart of SPY with a 14-period RSI
A basic explanation of RSI’s calculation is comparing the current price strength relative to past price strength. For example, a 14-period RSI on a daily chart will compare today’s price to the last 13 closes.
A high reading indicates that today’s price is strong, relative to the previous 13 closes, and vice versa.
Wilder intended the RSI to be used as a momentum oscillator: measuring how strong the momentum in a market is, but RSI came to be used differently.
Most traders use RSI as an overbought-oversold indicator, where a high reading means the stock is “overbought” and is bound for a pullback. In contrast, an “oversold” reading indicates that the market is due for a rally because it’s been sold-off too much.
This use of the indicator contrasts to the purpose of a momentum oscillator, in which a high reading indicates that the current trend is more likely to continue.
The 14-period RSI is the conventional time-series to use. It’s the one recommended in Wilders’ work and is the default in most charting platforms.
However, research from Larry Connors indicates that the 14-period RSI has a tiny edge, and that shorter-term RSI readings generate more profitable signals.
Connors’ research indicates that the two, four, and blended RSI periods show the best long-term trade expectancy. As a result of his research, Connors developed the ConnorsRSI indicator (which measures the rate of change of RSI), which is included with most charting packages nowadays.
2-Period RSI Backtest Results
Cesar Alvarez is a quant trader who worked for Larry Connors and became known for his use of the 2-period RSI indicator. Alvarez has published several backtests and reports about using the indicator in mean reversion trading.
Here’s a simple chart showing some trade results from 2007 to 2018.
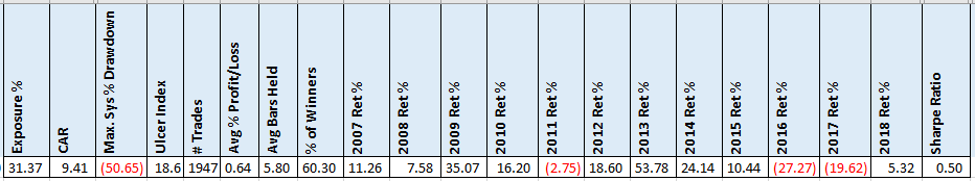
As we can see, 60% of trades were successful, with an average profit per trade of 0.64%—pretty encouraging results.
Using the RSI for Swing Trading
When using a short-term RSI like the 2-period RSI on a daily chart, the signals are only valid for a time. A short-term indicator like this is useful for small market swings.
For those of you familiar with George Douglas Taylor’s “three-day cycle,” the 2-period RSI is a valuable indicator for applying this system.
In this example, we’re looking to buy short-term pullbacks within uptrending stocks. In the popular research from Connors and Alvarez exploring this strategy, they consider a stock to be in an uptrend if it’s trading its 100-day simple moving average.
Rather than simply ensuring the stock is trading above its 100-day moving average to quantify an uptrend, I also wanted to see the stock outperforming the S&P 500, as well as bullish price action, and a rising short-term moving average (in this case I used a 20-day moving average).
We have to remember that the research done on these strategies is meant to prove the validity of the one signal: the 2-period RSI, so trades must be taken under very broad circumstances, or else the overoptimization makes it unclear which criteria is making the signal profitable.
Entry Criteria:
- Stock is trading above 20-day moving average the MA is trending upwards
- Stock is outperforming the S&P 500 index
- 2-period RSI is below 15
- Stock in an outperforming its sector ETF
These criteria ensure that we’re trading leading stocks in leading sectors.
Here’s an example in a Visa, a blue-chip growth stock which is both outperforming the financial sector and the S&P 500:
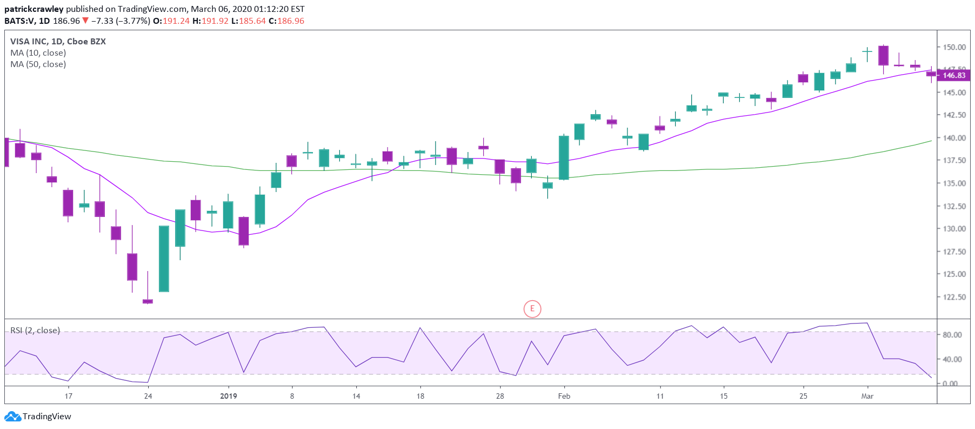
This would present a trade entry because the 2-period RSI is below the entry point of 15. Connors and Alvarez entered trades on the close (likely using market-on-close orders to get the closing print) in their research, but it’s probably fine to grab the stock at any point throughout the day, provided that the RSI is below 15.
Now, how do we exit? While you can come up with your own exit criteria, the research provided by Connors and Alvarez says to close the trade when one of two things happen:
- The stock closes above its 5-day simple moving average
- The 2-period RSI cross above 65
The Flow of Net Imbalances
Each day, there are tons of orders placed to get the closing print (market-on-close orders).
These are usually institutions like mutual funds and ETFs that require the massive liquidity provided at the market close. A few minutes prior to the close each day, the exchanges will disseminate information on the order imbalances at the market close.
That is, how many more shares are being bought than sold at the close? For example, if market-on-close buy orders are equalling 100,000 shares, and sell orders equalling 90,000 shares, that’s a +10,000 share imbalance.
Market makers arbitrage this in the short-term and make pennies, that’s not a timeframe we can compete in. However, we can track the money flow of a stock or sector by tracking the trend of the net imbalances over time.
If there are persistent closing buy imbalances in one sector, it’s indicating that institutions are accumulating a position in that stock. This gives us vital information that a significant price move might be on the precipice.
The tool I use to gauge imbalance money flow is MarketChameleon. MC allows you to simply view 20-day or 50-day moving averages of capital inflows and outflows of sectors, industries, indexes, or watchlists.
Here’s an example showing the 20-day moving average of daily imbalances in the financial sector:
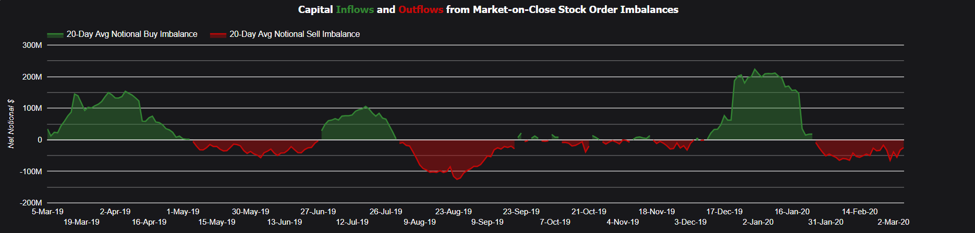
As you can see, recently, the financial sector has seen an average of $50M of net sell imbalances each day, indicating moderate liquidation of financial services stocks by institutions.
This is an indicator to be combined with other indicators. Tracking money flow provides you a top-down view of the market. The flow tells you which areas of the market money are leaving, and where it is headed.
Let’s take a look at another example below of Consumer Cyclical stocks below:
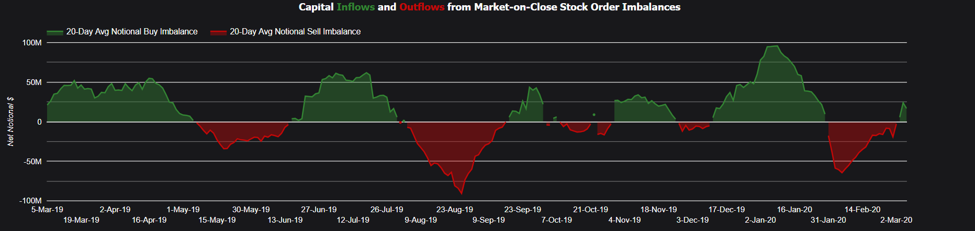
Right now, the market is in the process of digesting Coronavirus news.
The virus is in early stages, and there’s much uncertainty, and US stocks are selling off like crazy.
With this in mind, the fact that there are net capital inflows in the Consumer Cyclicals looks quite bullish. This might inspire us to look for long setups in the Consumer Cyclicals sector.
We might look for a trend pullback in a Cyclicals stock and use the 2-period RSI to find an entry.
MACD (Moving Average Convergence Divergence)
MACD is a momentum indicator oscillator.
Momentum basically measures the price’s rate of change, or in other words, how fast price increases or decreases. The indicator is calculated by comparing two moving averages, typically a short-term moving average and an intermediate-term moving average.
The most common MACD subtracts the 26-period EMA from the 12-period EMA.
This essentially means, is that when significant momentum enters a market, price is likely to continue in the same direction.
One of the main things I look for when trading with the MACD indicator is convergence. Basically, I’m looking for the MACD to make new high when price makes a new high, and vice versa.
When MACD doesn’t print a new momentum high when a market is breaking out, it makes the success of that breakout far less likely.
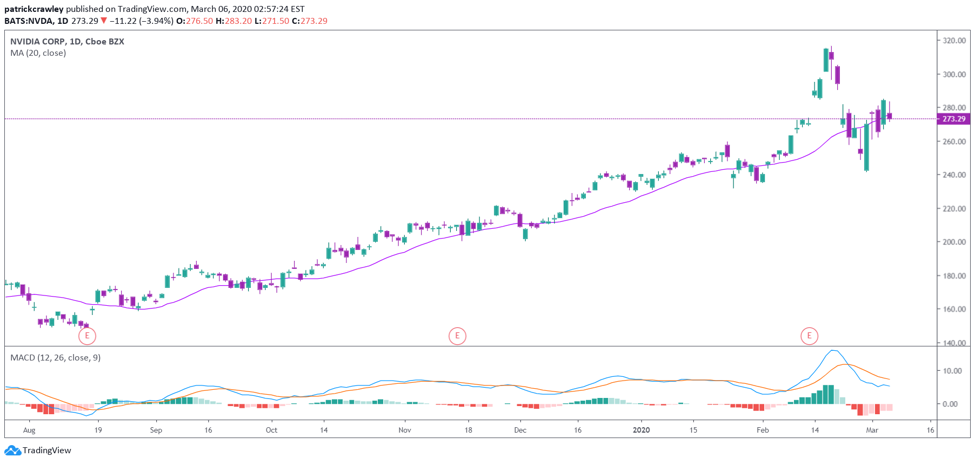
Here’s an example of both price and momentum are making a new high.

But how do we use this information? Personally, one of my primary uses of the MACD is in conjunction with the other two indicators outlined in this article: RSI and imbalance money flow.
I use MACD as a trend continuation indicator. I can see that significant momentum is present in the market when it makes a new high, and now I’m looking for the price to pull back a bit so I can enter.
On the pullback, I don’t want to see the MACD put in a new low. In an ideal circumstance, the market pulls back with low volume and volatility and doesn’t register a new momentum low on the MACD.
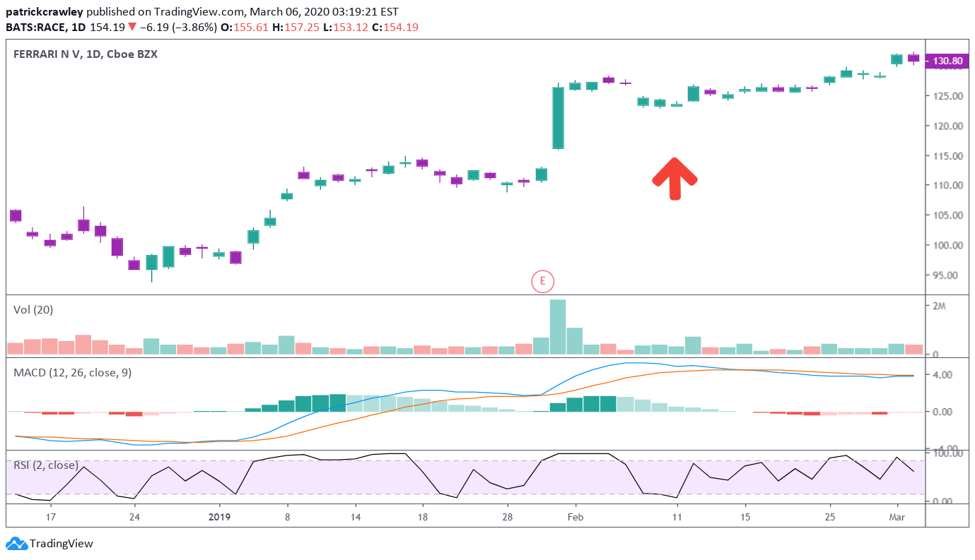
Here’s an example of a textbook setup in Ferrari (RACE). The stock made a significant new momentum high after earnings and slightly sold off to the point where the 2-period RSI was below 15, an entry point. Here’s what makes me like the setup:
- The pullback was on low volume
- The pullback wasn’t highly volatile
- The pullback didn’t register a new momentum low on the MACD. In fact, the MACD barely came off it’s highs.
- The 2-period RSI was below 15.
Here’s an example of a red flag setup, which might dissuade you from taking the trade:
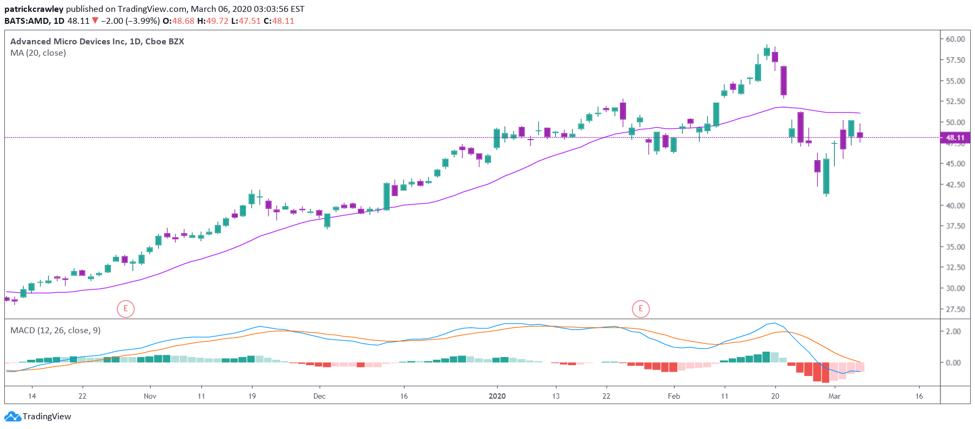
As you can see, when AMD made it’s most recent new high, the MACD didn’t make a new high, it instead reached the same level of the previous high, indicating waning momentum.
Further, we saw increased volume and volatility on the pullback, as well as a new low on the MACD, crossing below the zero-line.
Bottom Line
I believe mixing swing trading and day trading captures the best of both worlds. Day trading allows you to speculate on high-volatility catalyst stocks in a bit of a controlled environment: you can go flat at any time and aren’t holding overnight.
On the other hand, when you’re holding overnight, your trades are exposed to the market open and close, the parts of the trading session responsible for the most volatility. This can be a gift and a curse.
It’s kind of like leverage: it magnifies your wins, but your losses too.
The best swing trading indicators in this article are those that work for me and are by no means exhaustive.
We layout plenty of other great indicators like the Stochastics, the Average Directional Index, and Parabolic SAR in other articles.