

Momentum swing trading strategies are perfect for traders looking to capitalize on strong moves that tend to materialize quicker than other strategies on a higher time frame.
The Basics: Momentum Swing Trading Strategies
All trading strategies fall into one of two categories: trend-following (you’re trading in the same direction that the market is moving/has moved) and mean reversion (you’re trading against the current market direction because you think the market is overstretched).
Momentum in the stock market measures how fast the market is moving in one direction, or the velocity of returns. High momentum typically means high volatility, volume, and significant aggressiveness from one side of the market.
Momentum is firmly part of the trend following camp, but it differs from a traditional trend following strategy.
Your vanilla CTA-style trend following strategy typically uses moving average crossovers as a filter (aka, the 50-day must be above the 200-day), and a new periodic high (ex., new 50-day high) as an entry signal.
Traders of such strategies are usually Commodity Trading Advisors (CTAs), deploying a managed futures strategy on behalf of several clients.
Momentum based strategies are typically based on the velocity of returns. Momentum portfolio managers generally buy the assets with the highest returns in their lookback period (often 3-12 months), and sell the assets with the lowest returns.
However, this is the stiff, institutional style of momentum trading. They only do this because it’s a necessity. Because institutions manage so much capital, they’re constrained to broad criteria and longer-term lookback periods because their trades are market moving.
Smaller traders have the advantage of being nimble. Most of you reading can get in and out of a position within an hour. That’s a massive advantage that grants you strategy, time-frame, asset class, and liquidity freedom.
We believe that this aspect of being an individual trader is drowned out by the doom-and-gloom of most “retail traders are dumb” commentary. Of course, retail trading does come with many drawbacks, but the significant benefits are hardly pointed out.
In this article, we’re going to analyze some momentum swing trading strategies for the individual trader.
Overview of Swing Trading
Swing trading is kind of a catch-all term for short-term trading strategies that aren’t intraday.
Swing trading typically refers to positions held for longer than a day but less than a month. That’s it. Swing trading doesn’t involve a specific trading style or strategy.
There is a culture to swing trading, however. Whereas day traders weigh order flow analysis using tools like level 2, time & sales, and the depth-of-market, most swing traders contain their analysis to the charts.
They typically use moving averages and draw trendlines and use the daily chart.
Among the strategies deployed by swing traders are breaks from support or resistance, breaks from trendlines, volatility contraction patterns, and pullbacks in uptrends.
Today, our focus is on momentum swing trading strategies.
Breakouts From Consolidation
Before moving forward, let’s get our definitions straight. A ‘breakout’ in the stock market refers to when a stock price moves out of a long-established trading range.
When price breaks new ground like this, it’s typically accompanied by a high level of volatility and volume, and vicious price moves are the norm.
‘Consolidation’ in the stock market is when a stock price calms into a very tight range, relative to its trading history. You’ll also hear consolidation called range-bound or volatility contraction.
So, in summation, we’re looking for stocks that have narrowed into a tight range and buy or sell the breakout from this range.
Markets don’t move in a straight line. They typically move fluidly between periods of rest and periods of excitement. The quote “There are decades where nothing happens, and there are weeks where decades happen” applies here.
Most stocks are range-bound much of the time, and when they finally breakout, most of the big move occurs in a few days of price movement, only for it to settle back into rest.
For the majority of stocks, the ratio of contraction-to-expansion probably approximates the Pareto distribution; 80/20. However, there’s a small portion of stocks for which this ratio is more like 50/50, in other words, these stocks are making considerable moves half the time.
These are typically stocks that have high trailing 6-12-month returns and rapidly growing sales and earnings.
Stock Selection Criteria
The main idea when trading breakouts from consolidation is selecting stocks that are likely to make big moves when they break from consolidation.
Trying to make a breakout from consolidation work in boring stocks like Johnson & Johnson (JNJ) or Caterpillar (CAT) is much more complicated than a hot growth stock.
The Chart
The first, most obvious criterion is a qualitative look at the chart. You want a stock that is trending in the direction you’d like to trade (uptrends if you want to long, vice versa), and it should be moving up a good portion of the time.
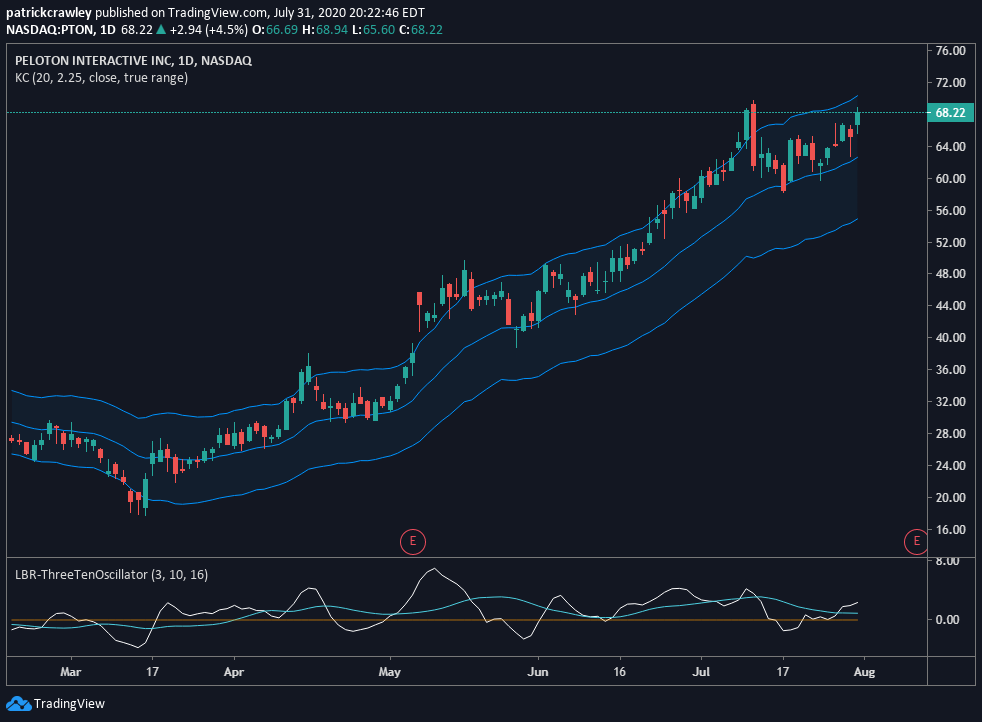
Here’s an example of a good candidate for this pattern:

The stock is in a strong uptrend and is consistently making significant moves. However, the stock is yet to consolidate.
Here’s an example of a bad candidate for this trading pattern:
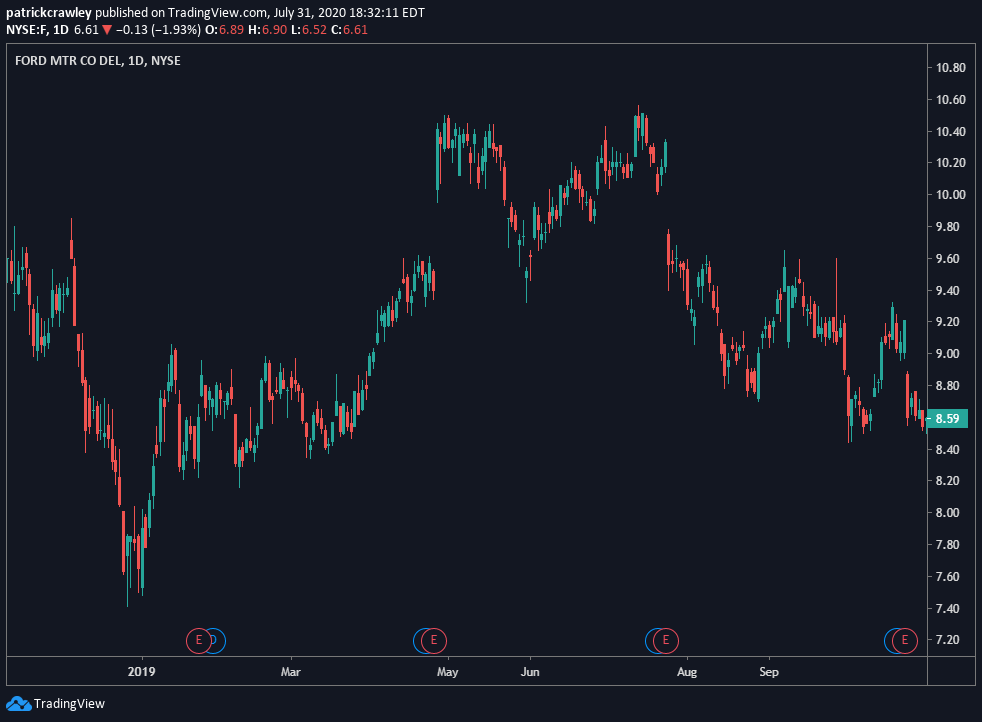
The stock has no discernable trend and is generally moving randomly in a range. There are no clues as to which direction a breakout from consolidation would be in.
Higher Lows
When the stock has entered consolidation, a key indicator in the pattern’s upside success is the formation of higher lows (vice versa for the short side) in consolidation.
Higher highs and lows are the building blocks for trends; they are what a trend is at its most basic. In consolidation, however, stocks tend to stop making new highs and trade in their tight range. Higher lows will still form, indicating that buyers are willing to continue “buying the dip” at continuously higher prices.
Here’s an example of what I’m speaking about:
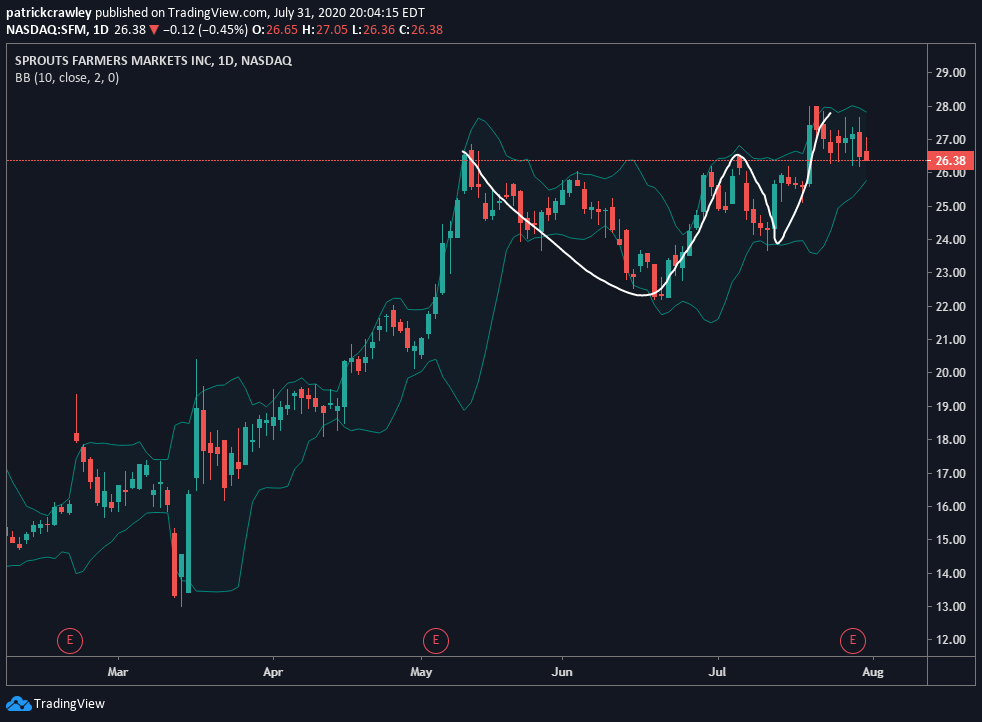
After being a substantial beneficiary of the Coronavirus market rally, Sprouts Farmers Markets (SFM) entered a perfect consolidation pattern, from which it recently broke out. Right now, prices are nearing pre-breakout levels, so the trade’s success is yet to be seen.
However, this is an excellent example of a breakout from consolidation.
Trend Pullback
The trend pullback is a classic trading pattern. The pattern involves identifying a stock in a strong trend, waiting for it to ‘pause’ and pullback a bit, and entering the trade.
This pattern is especially attractive to risk-averse traders who don’t like entering momentum stocks at new highs, as it allows you to enter at a more favorable price.
There is a caveat when it comes to trend pullbacks, however. In a trend pullback trade, you’re betting on the trend having another ‘leg’ upward. Typically, the first leg up is the strongest, and each leg declines in its momentum unless the trend is abnormally strong.
So, while you get to enter the trade at a favorable price, you’re not usually hopping aboard a runaway train.
We talked about the idea of how stocks go through periods of volatility, contraction and expansion. The trend pullback plays well into this. Just as volatility contracts and expands, so does price.
Again, stock prices don’t move in a straight line. Unless you’re trading Bitcoin during its boom, stocks usually have legs up and less severe moves down. This pattern of higher highs and higher lows creates a trend.
The idea is to enter on the higher low (vice versa for the short side).
Stock Selection Criteria
A technical stock selection process should always start with the chart. We should also use a qualitative observation of the stock chart to gauge whether or not we should trade the stock.
Here are some pointers. We’re assuming you’re trading uptrends, just reverse everything for downtrends:
The stock should be in a strong trend.
This is simple. The stock should be making a series of higher highs and higher lows, and shouldn’t be having trouble clearing support or resistance levels.
Green Flag Chart:
Red Flag Chart:
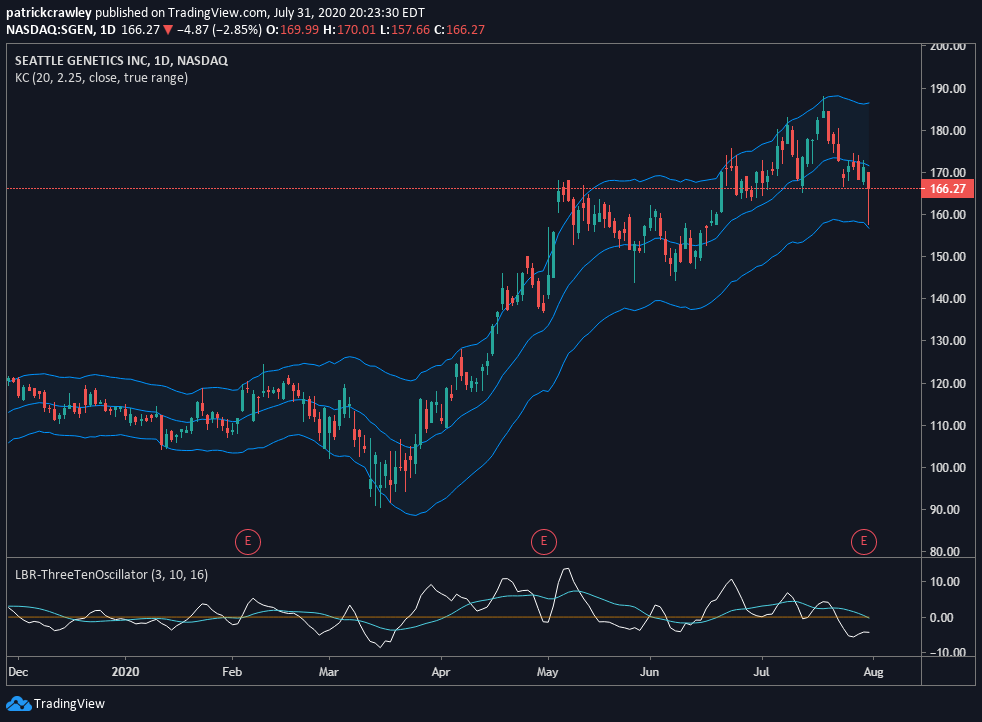
The trend is losing steam. Pullbacks are getting steeper and higher in magnitude, accompanied by new momentum lows. This is a bad example of a stock to trade the trend pullback pattern on.
Up moves should be more significant than down moves.
Pullbacks should be shallow and weak, while rallies should be steep with aggressive buyers willing to bid up the stock indiscriminately. Marubozu candles are a great sign. Momentum divergences are a bad sign.
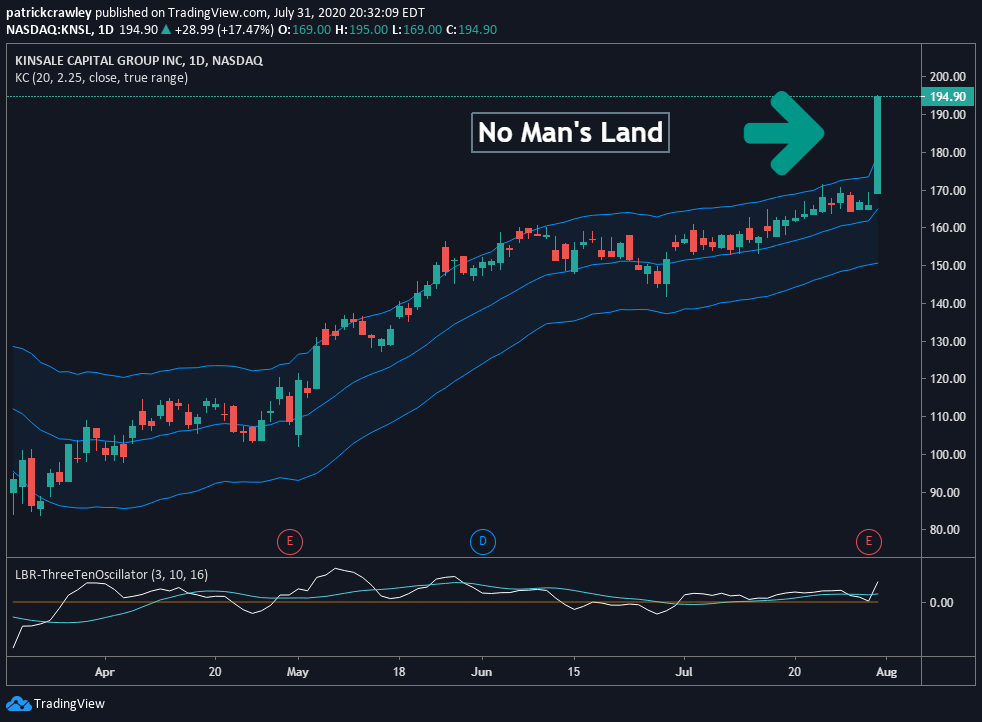
The chart shouldn’t be overextended.
When the stock is considerably outside of Bollinger Bands or Keltner Channels and recently made an explosive move, it’s better to stay away. While many traders have lots of success buying new highs in momentum stocks, trend pullback traders favor more stable and predictable trends.
Red Flag Chart:
There should be no momentum divergences.
You can measure this using MACD, Stochastics, or your preferred momentum indicator. If price makes a new high but momentum is low, the trend is losing steam. Conversely, down moves shouldn’t make new momentum lows.
Red Flag Chart:

Observe how Digital Turbine (APPS) is making new all-time highs, but the momentum is still near lows. The trend seems to be losing steam, and all-time highs take considerable momentum to maintain.
Bottom Line
To summarize momentum swing trading strategies, here are the main points:
- Retail traders have a significant advantage when it comes to their ability to trade in-and-out of positions swiftly. The big “Smart Money” doesn’t have this luxury, nor the luxury to play in smaller stocks.
- Swing trading just means holding a position overnight, typically for less than a month. It doesn’t say anything about the specific style or strategy being traded.
- Markets, like the ocean, go through periods of calm and rough waters. The breakout from consolidation pattern aims to hop aboard the train during the quiet periods, to capitalize on the upcoming expansion.
- Markets don’t move in a straight line. Even the strongest trends pullback, leaving opportunities for risk-averse traders to join strong trends during a ‘pause’ in the trend and participate in the next leg up.