

Knowing how to find stocks to swing trade is just the beginning of your journey, but a crucial step towards your success.
Swing trading enables you to capture a much larger piece of a market move compared to day trading, but also leaves you open to overnight risk.
In comparison to day trading, swing trading definitely has its pros and cons. At the very least, having the tools to make the occasional swing trade allows you to pull the trigger when the odds are in your favor.
Putting the Tailwinds in Your Favor
As a rule of thumb, stocks that have consistently advanced will continue to advance, and vice versa.
As a consequence of this trading principle (that you don’t have to buy into, many do not), it’s logical to focus our swing trading efforts on stocks that are moving in the direction we want to trade.
If we want to go swing trade on the long-side, we want to find stocks that have been advancing and vice versa.
There’s no reason to reduce our expected value by trying to catch falling knives.
We start from the top-down. That’s from the top of the stock market. The first thing we should establish is a directional bias: should we go long or short? We decide this by analyzing the price action of the overall stock market, in this case, the S&P 500.
Below is a weekly chart of $SPX. The index has been uptrending for the better part of a year at this point, but we just saw a pretty significant pullback below the 20-week moving average.
The index still hasn’t put in a lower low on the weekly yet, so the trend hasn’t broken. However, this is a reason for caution; we shouldn’t be too aggressive with any of our positions.
With this in mind, we should still be focusing on making cautious long trades when the opportunities present themselves.

Now that we have a long bias, we want to be buying stocks in the strongest sectors. So let’s take a look at all of the major sectors.
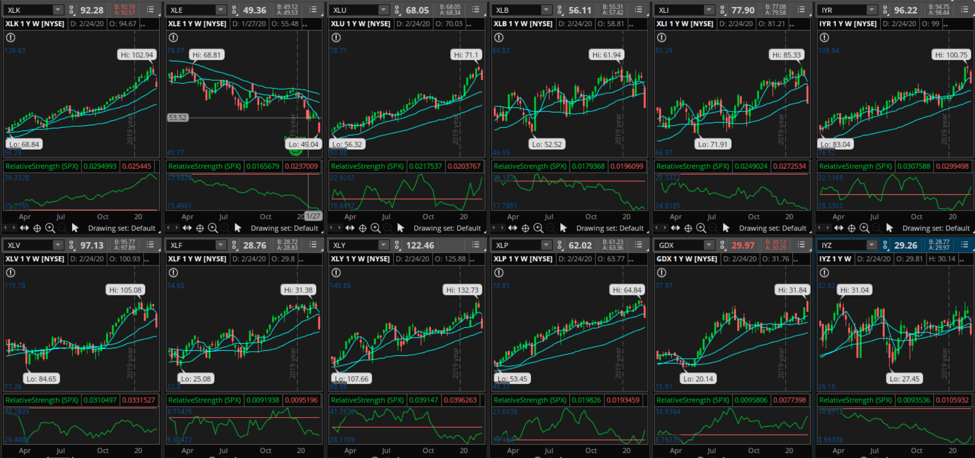
I gauge this through relative strength and price action. I look for sectors that are outperforming the S&P 500, are in uptrends, and have bullish technicals.
The relative strength indicator I’m using is a built-into ThinkOrSwim. You can use any security as the benchmark. I just use the S&P 500, the de facto stock market benchmark. The indicator is called “RelativeStrength.”
By the way, when I refer to relative strength, I’m not referring to the Relative Strength Index (RSI), I’m referring to the strength of a security’s price movement relative to another. In this case, we’re comparing the relative strength of sectors against the S&P 500.
We can easily see that the Information Technology sector, as represented by the XLK ETF, is the best performing sector as evidenced by its significant outperformance of the index as well as it’s strong uptrend.
Utilities (XLU) and Gold-Mining (GDX) are also outperforming decently. I don’t care about Utility stocks because they don’t move enough, so we’ll look for long setups in the Tech and Gold-Mining sectors.
Through that simple filtering process, we just raised our odds of having a successful swing trade considerably.
Screening for Stocks
So now that we have two sectors in which we’d like to focus within, we have to start screening for stocks. There are a few criteria I look for, and they are, roughly:
- Liquidity
- Outperforming the stock’s own sector
- Clean uptrend
- Not overextended on the daily chart
- Leading stocks in leading sectors
Liquidity
The importance of liquidity can’t be overstated, but I think the concept gets misconstrued when taught to budding retail traders. The critical thing here is that you need to be able to establish and exit a position relatively swiftly.
I prefer my orders to account for much less than 1% of the stock’s daily trading volume. So if you’re taking a $10,000 position, you should look for stocks that are trading at least $1,000,000 in average daily dollar volume.
The area where I think educators get retail traders mixed up is when the educators conflate their position sizing with that of a retail trader of a small account.
For a wealthy full-time trader, they may require a stock to trade $500 million in dollar volume to meet their liquidity standards.
However, if your average position size is $100, this isn’t really required, although I’d still prefer to trade in stocks that trade at least a million dollars in daily dollar volume because liquidity can quickly dry up when things get bad.
Sector Outperformance
In the same manner that we compare a sector to its parent index, we compare a stock to the sector it’s a part of.
We want to be trading leading stocks within leading sectors. This gives us not only the best odds at a winning trade, but also the best odds of a runaway trend that can turn a 3-day swing trade into a months-long winning position if we desire to hold it for that long.
Clean Uptrend
I prefer a stock to have a reduced daily range and volume on pullback days. One of the biggest red flags is when a momentum stock pulls back by gapping down, only to continue to rally again.
This is indicating that as soon as sentiment shifts, there are lots of weak hands ready to liquidate.
Here’s an example of an uptrending growth stock that grinds up slowly and crashes down during pullbacks, the opposite of what I look for. This is a not a setup I’d prefer to swing trade:

Notice the substantial red candles and violent gap downs.
Not Overextended on the Daily Chart
As a stock moves significantly deviates from it’s “mean” (whether that’s a moving average, trading bands, etc.), a pullback becomes more likely, which makes it an unworthy candidate for a short-term swing trade.
Here are a few examples of what I would consider an overextended daily chart:
This one is a pronounced example of a situation where unless you have a deep fundamental understanding of the catalyst, should be avoided. The stock is essentially in no man’s land and is essentially a speculation vehicle for the coronavirus.

Below is a better example of your typical overextended daily chart. Keep in mind that I’m not applying hindsight bias here, I’m not saying that the stock tanked because it was overextended.
The stock tanked because the market tanked, and SPCE was the first example to pop into my head when talking about this concept. The point here is that the odds of the stock continuing to run in the short-term when it’s overextended diminish.

An overextended stock will typically have candles with huge ranges outside of your trading bands of choice (I use Keltner Channels with a 2.25 ATR multiplier). These stocks have many characteristics that mirror a trend climax, and I prefer not to be on the wrong side of one of those.
Sample Stock Screen
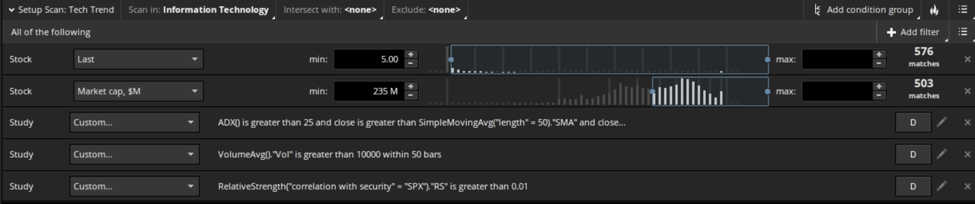
Here’s an example of a typical screen in the ThinkOrSwim platform. Here are the parameters for the tech stock screen:
- Trades at least 10,000 shares a day (50-day volume average)
- Stock is trading above $5.00
- Stock’s market cap is above $235M
- Stock is in the information technology sector
- Stock is outperforming both SPX and XLK
- Stock is trading above both it’s 50-day and 20-day simple moving average
- Stock’s average directional index (ADX) is above 25 (ADX is a trend strength indicator)
Here’s what the screen setup looks like in ThinkOrSwim’s Stock Hacker. Notice that I omitted the XLK relative strength screen because it’s too difficult to setup. The screen fetches a small list of stocks, making it easy to gauge it’s relative strength against XLK manually.
Here are the parameters for the gold-mining stock screen. The only change is the sector ETF they need to be outperforming:
- Trades at least 10,000 shares a day (50-day volume average)
- Stock is trading above $5.00
- Stock’s market cap is above $235M
- Stock is in the gold mining sector
- Stock is outperforming both SPX and GDX
- Stock is trading above both it’s 50-day and 20-day simple moving average
- Stock’s average directional index (ADX) is above 25 (ADX is a trend strength indicator)
Market Environment
Because I’m writing this article during a significant market correction, these screens are fetching fewer stocks, and many of them are in the midst of a pullback.
This is great because I prefer intratrend pullback trades, but during a market correction, many stocks’ correlation to the market increases due to the selling pressure across the board.
If you’re trading unhedged, as most do, it’s essential to keep in mind the general trend of the market, because the index’s performance will be responsible for a sizeable portion of a stock’s performance.
Entering a Trade
I like to trade short-term intratrend pullbacks. Basically, I’m looking to enter on a lower high within an established long to intermediate-term trend and ride it back up for a few days. Sometimes these trades will turn into runaway trends, lasting weeks to months, but the majority are quick 2-3 day-long trades.
As for entry timing, it’s hard to beat the 2-period RSI indicator. Larry Connors, a quantitative trader, mostly focused on mean reversion trading, has published a wealth of research on the positive expectancy of trading pullbacks using the 2-period RSI.
The entry criteria are quite simple, enter when the 2-period RSI is below 20. The exit criteria are as simple: exit when the stock either closes above its 5-day simple moving average or the 2-period RSI crosses above 60, whichever comes first.
I also make sure the oscillator hasn’t been making lower highs with each leg up of the trend, which indicates a weakening trend.
Example Setup

As we can see, the company has been outperforming both the S&P 500, as well as the technology sector. It’s been in a steady uptrend for months now and just reported a considerable earnings beat.
Due to the market correction, the stock has sold off back around it’s 20-day moving average. I like these types of plays because the market decided the stock was worth more after the earnings report, and the price was only pulled down by mass selling pressure in the market.
As we can see, the pullback is following a significant new momentum high on the 3-10 oscillator, and the pullback didn’t create a new momentum low.
The stock is also in buy territory, evidenced by its 2-period RSI reading of 8.
Of course, by the time of publishing, this setup will already be dead and gone, but this is an excellent example of a good swing trade setup even during a substantial market correction.
Bottom Line
It’s critical to remember that when you’re swing trading, you’re much more at the mercy of the broad market than you are in a catalyst-driven day trade, which is usually reasonably uncorrelated to the market.
Because of this, it’s not only key to ensure that your swing trades are in harmony with the broad market, but also that you’re going to lose many swing trades that otherwise looked like excellent setups.
In these situations, it’s best to cut your losses and keep the stock on your radar for entry at a later date