

As a swing trader, or any active trader/investor, you should have a daily routine that your perform consistently.
The amount of market analysis a technical trader performs each day should be roughly proportional to the trading time frame.
In other words, if you trade on weekly charts, it makes no sense to watch each intraday tick in the market because it’s all noise relative to your timeframe.
On the other hand, it makes sense for active day traders to be at their terminals all throughout a trading session, scanning for and executing upon trade ideas.
While many pay lip service to screen time, which is mostly time spent staring at charts, contemplating and executing trades, it has to make sense for your trading time frame.
It’s not uncommon for a trader to be holding a stock based on it’s weekly chart pattern, only to liquidate their position intraday because of a broken support or resistance level on the 5-minute chart. This makes no sense.
Further compounding this issue is the social aspect of trading.
It’s cliché to talk about FOMO in a trading article for the 10,000th time, but water cooler and social media-driven FOMO is at an all-time high in this market.
Everybody is talking about their gains in Dogecoins, the next hot short squeeze, or option dealer-driven gamma squeezes. If you’re hearing all of this while sitting on your hands long some boring insurance company because of the daily chart pattern, it’s hard to resist style drift.
One of your defenses against FOMO and “the next big thing” is having a specific trading routine. Once you get into the routine, it’s yours.
Your own personal approach to the market, giving you the confidence to ignore rumors and noise and execute on your plans, whether or not you see similar gains to the hot thing on Reddit that day. It’s difficult to overstate the importance of establishing and taking ownership of this routine because the alternative is chaos and randomness.
If you haphazardly search for trade ideas from a combination of FinTwit, screeners and scanners, Reddit, and just typing in recently volatile tickers to your charting platform, you are at the whims of whichever content you happen upon that day.
Many times you’ll find great patterns, but notice that you’re late because you’re finding out about them from outside sources.
So let’s review a template of a daily routine for a swing trader.
Everyone’s routine is different and dependent on your strategy, but this is a ‘vanilla’ approach for technical traders without a routine.
The Start: After The Close
You should prepare for the opening bell the night before if your schedule permits it.
You’re not competing against the clock nor do you have to rush to your computer in the morning to ensure you have enough time to prepare for the open. Of course, this only applies to folks that live in a similar time zone to New York.
By doing all or some of the prep the night before, you’re giving yourself some options in the morning to sleep in, get stuck in traffic, take an extended morning routine, etc.
Step One: Managing Open Trades
Manage what you have first.
For some, trade management is done once executed. Stop losses and profit targets are set and forgotten about, allowing the market to do what it does. But most swing traders are more tactical.
We tighten stops or profit targets, add or liquidate portions of our positions, or even hedge them with options or a correlated security to manage event risk.
This part is simple and pretty specific to you.
But if there’s one specific thing to do, take one good look at the position in your trading time frame and assess if the position needs managing. You might have been watching the positions throughout the day on intraday charts and you need to ensure you’re still seeing the big picture.
Step Two: Develop a Broad View
It becomes a lot easier when you can focus on specific corners of the market. Rather than screening through your entire universe of tradable stocks each day, you can focus on the areas where lots of trades are setting up.
One way to do this is simply to view all of the sector ETFs together and see which ones are setting up. This doesn’t have to be complicated, just create a watchlist of the major sector ETFs and scan through their charts to find which areas to focus on.
Here’s an example of a chart with a daily chart of 8 of the 9 major sector ETFs (excluding utilities):
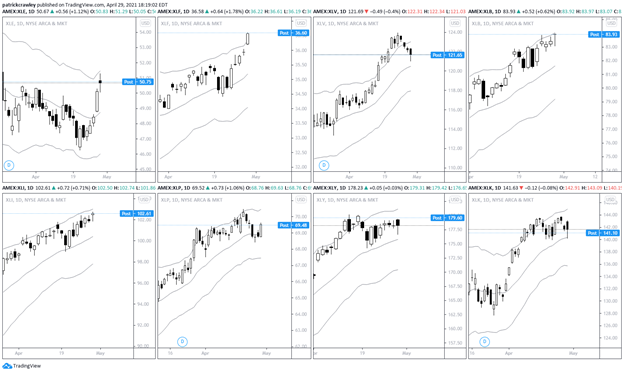
We can quickly glean some insights here.
Financials (XLF) are at highs, so if we trade pullbacks or consolidations, we might not find many candidates within financials. Basic Materials (XLB) is setting up a potential breakout trade, so we might want to take a look at it’s sub-industries like gold and copper to see if one commodity is driving the move.
Healthcare (XLV) is pulling back within a very strong uptrend, so we might screen specifically for healthcare stocks.
Again, this doesn’t have to be hard. This plays on the same theme used by William O’Neil and the Investors Business Daily philosophy. Find the leading groups first, then we can focus on those to make the process of finding the leading stocks easier.
Step Three: Finding Trade Ideas
If you can’t explain your process for finding trade ideas in 15 seconds, you probably don’t have a specific process for it and should fix that (in most cases).
First, you should think about what you’ve done historically to find ideas. Is it a consistent method for finding ideas, good or bad, each day/week/month?
Let’s consider some poor methods for finding ideas consistently (this applies to technical swing traders specifically, what might be great for a global macro trader is probably a distraction for the technical swing trader).
Bad Process: Reading News
Reading a news feed or a publication like the Wall Street Journal might be fine for finding upcoming catalysts, but it’s the incorrect format for technical swing traders to consistently find ideas.
If you trade one or a few specific patterns, what are the chances that the specific catalysts occurring will set up in a tradeable fashion for you? It’s worth considering the return on your time invested for each trading-related activity you perform.
If you trade a basic technical style, my guess is that reading news is probably a low-return activity.
Bad Process: FinTwit and Social Media
Many traders decry social media traders from Discord, Facebook groups, TikTok, and whatnot, but will without hesitation make trades based on their favorite FinTwit commentator’s opinions.
There’s a lot of really smart traders on there, but there’s two problems with following their plays. The first, is that your timeframes and strategies are often different then there’s.
Most traders on FinTwit are market bears, love gold, and predict significant dollar inflation. These are broad macro views that could take years or months to play out, yet, countless short-term traders follow these picks to place trades on the 5-minute or daily chart with a tight stop loss.
The second problem is that it’s an inconsistent, unsystematic source of ideas and there’s latency between when the pattern emerges and when you see the pick.
Many FinTwit commentators are extremely prudent and make great market calls consistently. If their research is good, there’s nothing wrong with applying it to your trading, but few, if any, successful traders scan their Twitter feed and start making trades.
If you instead rely on a consistent process for scanning through charts, their ideas will show up in your screens anyways if they’re good enough.
Bad Process: Interpreting Macroeconomic Data
There’s a trend among shorter-term traders towards trying to interpret macroeconomic data and outcomes in the last few years. With memes about the Federal Reserve printing money going viral, everyone wants to understand the plumbing of global financial markets.
However, this is best left to the macro hedge funds, and not short-term technical traders.
Good Tools: Screeners and Scanners
There’s thousands of different stock screening and scanning services. They sell themselves based on their ability to scan for technical patterns, order flow, unusual options activity, dark pool activity and a million other things. I think simpler is better for technical traders.
There’s no reason to get super complicated with your screens. Sifting through a few dozen, or even a few hundred charts doesn’t really take that long.
When screening, think about your strategy in very simple terms.
If you’re a trend trader, you buy things that are going up. If you’re a mean reversion trader, you buy things that are going down. If you like to trade failures or breakouts from significant levels, you can screen for stocks within a few percent of their N-day highs or lows.
You could perform these simple screens in most free screeners like FinViz or TradingView’s free screener.
Let’s look at an example in FinViz, a great and free screener. We’re going to look for trending stocks within the healthcare sector. Here’s a barebones screen that provides us with a manageable 46 stocks:
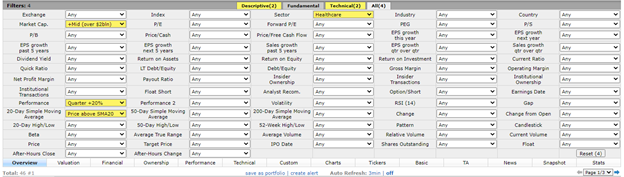
Simple.
The market cap screen is basically a liquidity screen, because FinViz doesn’t have a dollar volume filter (many healthcare stocks are several hundred dollars per share, making a raw share volume filter ineffective), and we just look for good performance over the previous quarter and price above the 20-day moving average to ensure the stock is still trending.
You can get a bit more fancy with your screens.
Maybe you can use ADX (Average Directional Index) to gauge for trend strength, or perhaps look for stocks trading above their Bollinger Bands.
Whatever floats your boat.
But remember, you’re not trying to program your actual trade setup into your screener–that will just result in you getting few results and missing several potentially great trades.
Try to boil your style down to its simplest form. When screening for trends, look at performance and maybe some very rough technical indicators.
When screening for mean reversion, perhaps a low RSI, low recent performance, or the stock trading below its Bollinger Bands will work.
Step Four: Filter Down Your Screen Results
I like to export my screen results into my charting platform, in this case, TradingView and create a watchlist from them.
This way I can use my arrow keys to quickly filter through the tickers. TradingView has a great flagging system where you can add a flag to a ticker on your watchlist. This goes onto its own flagged list.
For example, I flagged LUNG here, it’s now in my “blue list.”
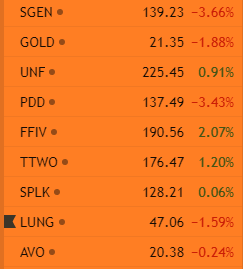
Each ticker that looks like a potential trade setup, add a flag and move on. You can do this fairly quickly and you end up with just a handful of stocks. From there, you can use your own technical analysis and intuition to decide which stocks to trade.
Maybe one chart looks more linear than the rest, maybe you like the way one stock trades better.
At this point, you will have a list of stocks (if any) you want to trade at tomorrow’s open.
Step Four: Prepare Your Trades
Now you have to decide how to size and execute your trades. Will you place a buy stop above a level you want to participate in? Will you just buy (sell) at the open?
This is completely up to your own trading style, but this is something that needs to be figured out and also be consistent.
You should figure out the following:
- Execution style: enter at break of a level or enter preemptively?
- When to enter? At the open, intraday, at the close?
- Position sizing: this should be up to your strategy, but if you’re haphazard with your position sizing, consider implementing R multiples into your trading.
- Exit plan: where will you place your stop loss? You can use something like a multiple of the ATR, or you can use levels in the market to guide you. This really depends on the market structure.
After performing these basics on each trade, consider your portfolio. Things like correlations and your level of exposure are things to keep in mind. Maybe tons of healthcare stocks are setting up so you choose a few of those that you want to buy.
If the healthcare sector gaps down tomorrow, all of your stocks will be in the red, even if the patterns are good.
There’s a saying among traders that says “take only the risks you’re paid to take, hedge the rest.” This basically means that your edge in this trade isn’t really in taking market or sector risk, but in taking the risk in these individual stocks.
Does that mean you should hedge by shorting the healthcare ETF? Not necessarily, but you should consider the full scope of the risks you’re taking on.
Step Five: Some Prep Work
A swing trader is typically wrapped up in his own stocks and it’s easy to forget about the broad market. But getting in tune with the broad market can help you choose where to lean.
If the S&P 500 is super bullish, you might consider, at the very least, reduce your short exposure relative to your longs.
Journaling is also a huge benefactor.
It’s cliche, sure, but once you start writing your thoughts out, your brain allows you to access parts of it that you were subconsciously blocking out. You might realize that you tend to trading small and “hiding” from the market during losing streaks, or perhaps there’s a correlation between personal problems and your P&L.
Plenty of questions and curiosities you have about trading will start to flow out of you too. Random ideas like improbable arbitrage trades or potential correlations that you might never implement, but they get you thinking a bit more creatively about trading.
Bottom Line
Implementing a daily routine that fits your trading style and schedule is imperative to your success as a trader. It really can’t be overstated.
Consider that many of the top minds in the world dedicate their life to understanding and profiting from financial markets.
You can’t expect to just show up and get paid.