

Candlestick patterns are representations of market data. They give a clear picture of market movements and tell us a lot about how buyers and sellers interacted at any given time.
In this post, we are going to talk about an important Japanese candlestick pattern called bullish abandoned baby pattern.
We will explain what it is, what it looks like, why it forms, and how day traders can implement the pattern in their strategies.
What is the Bullish Abandoned Baby Pattern?
The bullish abandoned baby is a pattern that appears at the end of a downtrend and signals reversal to an uptrend. Simply put, it signals an end of the selling pressure of the bears and return of the bulls in the market.
This pattern consists of three candlesticks: the first candle has a black (or red) big body, the second is a small and bearish candle – or a Doji, and the third is white (or green) candle.
The shadows on the Doji should be fully gapped below the shadows of the first and third candles.
A Doji candlestick is a candlestick that has the same opening and closing price, and symbolizes indecision between sellers and buyers.
What the Bullish Abandoned Baby Pattern Looks Like
Now before we continue, it is important to get to see how this pattern looks so you can easily identify it on charts.
As mentioned earlier, the bullish abandoned baby pattern is made up of three candles, where the first is bearish and followed by a gap to the downside.
The second one gaps down and becomes a Doji, while the last candle gaps up and ends as a positive candle.
This is how the pattern looks like:
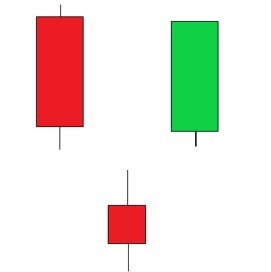
Here is a list of the conditions that must be met for the pattern to form:
- The first candle has to be negative and part of the ongoing downtrend.
- The second candle has to be a Doji that gaps down from the previous bar.
- The last candle must gap up, and end as a tall bullish candle.
- The bodies and the wicks of the three candles don’t overlap with each other.
Why It Forms
By now, you are already aware that the bullish abandoned baby pattern appears in a downtrend, indicating a bullish reversal. Its appearance in a chart indicates an end of the selling streak and return of the bulls in the market.
In other words, the pattern forms because the forces of selling stocks are shifting to buying stocks. This can happen when traders expect a trend change because of fundamental or psychological reasons.
Example of a Bullish Abandoned Baby Pattern
Here is a closer look of a chart showing what we are talking about:
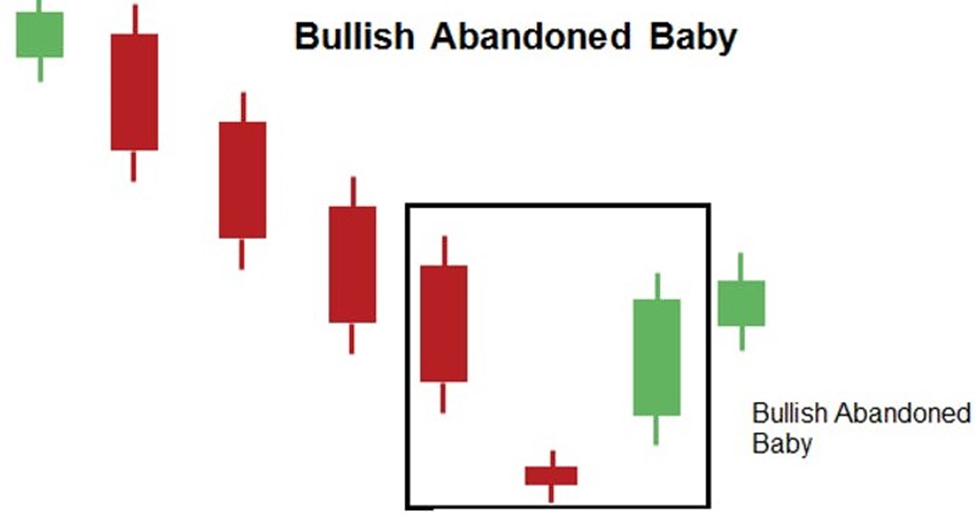
As you can see, the first candlestick is long and bearish, while the second has a very short body or a Doji and gaps so low that its high price is below the low price of the first candlestick.
The third candle is long and bullish, and gaps so high that its low price is also higher above the high price of the second.
The psychology behind the pattern implies that the market has a sell-off or significant drop in the trend – the first candlestick.
A Doji later appears, confirming that a levelling-off is happening with opening and closing prices being same.
The Doji suggests that bears are gradually losing the grip and bulls are trying to take control of the market. The third candle forms in the uptrend and gaps higher from the Doji.
After the formation of the bullish abandoned baby pattern, traders expect that the price will continue to go up and bulls are back into action.
Tips for Trading the Pattern
When the bullish abandoned baby pattern is accompanied by strong volume surge, this typically means we have a strong wave of the buyers coming in.
Initially, we had panic selling then buyers attracted by a low price quickly upped their pressure (buying demand) and began to buy in large volumes from bearish traders selling in panic.
This new wave of the buyers was able to absorb all selling supply of the bears and it became the dominating force.
In this case, we have huge rise in demand, this reversal signal is strong – the new wave of the buyers might push price up much higher.
When this pattern is witnessed on a low volume, it indicates that the change in the supply/demand balance is the result of the sellers easing their pressure. In this case, a reversal signal is weak because there is not increase in bullish pressure (demand).
The buyers are weak, and, if the sellers begin selling again, they will have no trouble sending price lower.
When trading this pattern, traders should enter above the third candle. If the price continues to go up, you can use it as an opportunity to buy. You could place a stop-loss below the lower wick of the second candle (Doji).
Traders must remember these points when trading with the bullish abandoned baby pattern:
- The prior trend should be a downtrend.
- The real bodies and shadows shouldn’t overlap with each other.
- The third candle ought to be in the opposite direction of the first candle and also should gap in the opposite direction of the Doji.
This pattern is quite accurate at forecasting a reversal, but the reversal tends to be short-lived in nature.
So, it ought to be combined with other forms of technical analysis such as price action analysis, parabolic SAR, relative strength index (RSI), Stochastic Oscillator and Fibonacci Retracement.
It is also advisable to place a stop-loss just below the down shadow of the Doji.
Bottom Line
The bullish abandoned baby pattern is fairly accurate in predicting a reversal. It signals reversal to an uptrend and day traders often use it to get into a buy position.
Despite being a rare pattern, traders put their faith on it to adjust their position. It is often considered a reliable pattern compared to the other Doji formations and a more definite indication of a trend reversal.
That is because each candle is uniquely formed and don’t overlap.
However, what happens after the formation of this pattern is not always as clear-cut. Therefore, most traders usually complement it with other technical analysis tools to set specific price targets.