

Harmonic Patterns are a type of complex patterns that occur naturally in financial charts based on geometric price action and Fibonacci levels.
The patterns were introduced to the trading world by Harold McKinley Gartley in 1932. Gartley created a pattern which he named after himself and outlined in his 1935 book, Profits in the Stock Market.
When properly identified, harmonic patterns allow traders to enter the trade in a high probability reversal zone with minimal risk. Harmonic trading techniques utilize Fibonacci price patterns and numbers to quantify these relationships.
They offer a means to establish where the turning points will occur.
What are Harmonic Patterns?
Harmonic patterns are trend reversal patterns that are based on the Fibonacci extensions, retracement levels, and geometric structures.
These patterns provide traders the potential reversal zone, which help to hop in reversal trades at the brink of exhaustion.
What do these patterns look like?
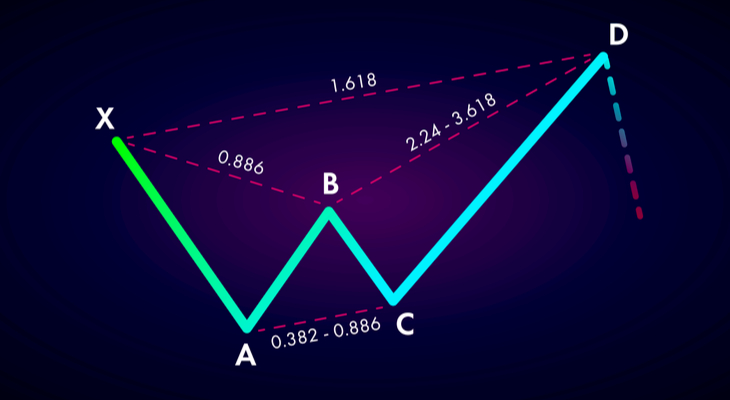
In general, all harmonic patterns are based from 5 turning points in price.
However, each type of harmonic pattern has a different geometrical shape and Fibonacci ratio. We name these points X, A, B, C and D. Each harmonic patterns follows its own set of rules that will discuss in greater detail later in the article.
Why these patterns important?
The main importance of harmonic patterns is to predict price movements.
By finding patterns of different magnitudes and lengths and applying Fibonacci coefficients to them, day traders can try to forecast the future movement of financial instruments like stocks, options, and more.
Harmonic patterns are the key to identifying reversals. They are a very precise instrument, characterizing very specific price movements.
Types of Harmonic Patterns
Although there are many types of harmonic patterns, only a few have stood the test of time because they form more frequently on the price charts. In this section, we will go through each one and outline their differences.
The Butterfly Pattern
The butterfly pattern is a reversal pattern that is often found at the end of a trend move. It was introduced by Bryce Gilmore and is made up of five points: X, A, B, C, and D.
Below is a diagram of the butterfly pattern
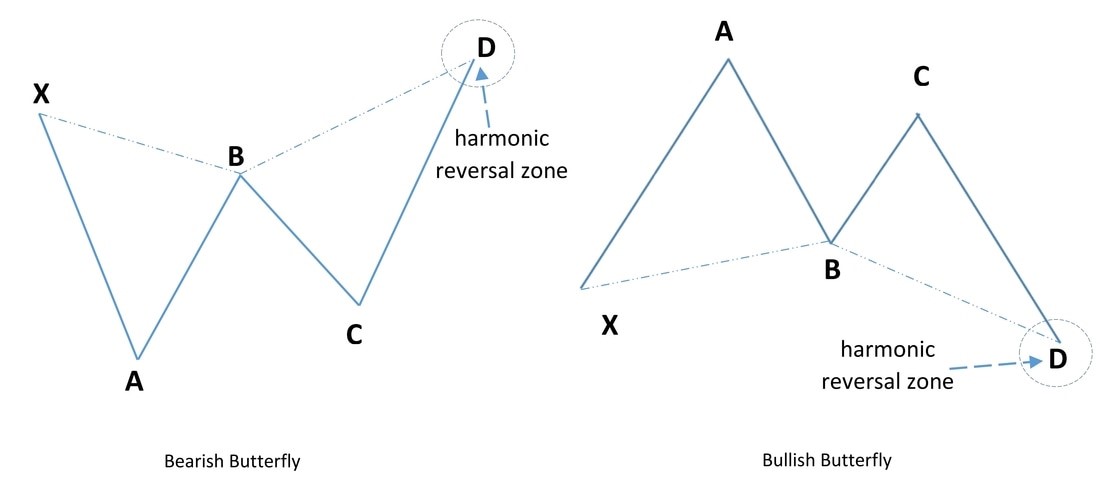
The pattern can form two formations: The bullish butterfly, which indicates when traders should buy, and the bearish butterfly, indicating when traders ought to sell.
Butterfly patterns help traders in spotting the end of the current move so that they can take the trade.
The bullish and bearish butterfly patterns have the following characteristics that can be used to identify them.
- AB can retrace up to 78.6% of the XA leg
- BC can retrace between 38.2% – 88.6% of AB
- CD can be an extension of 1.618% – 2.618% of AB
- CD can also be an extension of up to 1.272% – 1.618% of XA leg
- The point D is known as the Potential Reversal Zone (PRZ)
From Point D, you can enter a trade with stops at or above (below) the price point at D.
The Gartley Pattern
The Gartley pattern is a simple harmonic pattern that is preceded by a significant low or high. As mentioned earlier, this pattern was developed by Harold McKinley Gartley. It is also known as the ‘222’ pattern based on the page number it is outlined in his book, Profits in the Stock Market.
Gartley patterns usually form when a correction of the overall trend is taking place. The Bullish Gartley patterns are M-Shaped while bearish patterns are W-shaped.
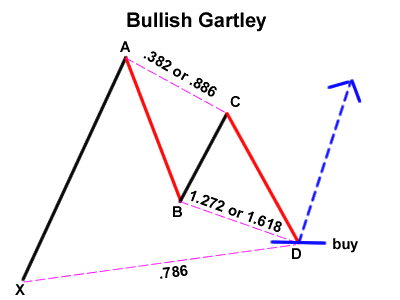

The rules for a harmonic pattern to be called a Gartley pattern are:
- AB leg should retrace about 61.8% of leg XA
- BC should retrace 38.2% – 88.6% XA
- CD is at least a 78.6% retracement of leg XA
The Bat Pattern
The Bat pattern was discovered by Scott Carney in the early 2000s. Like the Gartley pattern, the Bat pattern is a retracement and continuation pattern that forms when a trend temporarily reverses its direction but then continues on its original course.
This pattern allows traders to enter a trend at a good price just as it is resuming.
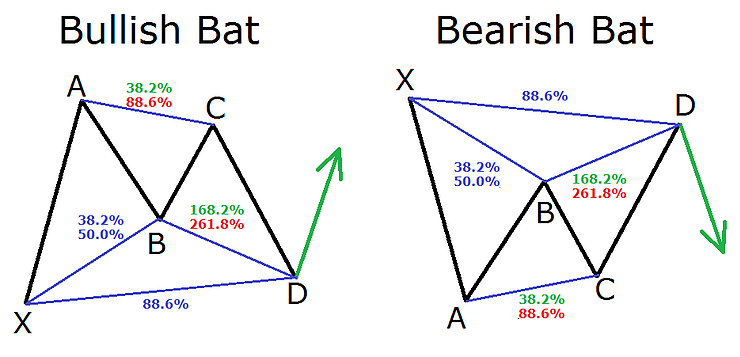
The main rules of the bat pattern are as follows:
- AB leg can retrace between 38.2% – 50% of XA leg
- BC leg can retrace between 38.2% – 88.6% of AB leg
- CD leg can retrace up to 88.6% of XA leg
- CD leg can also be an extension of between 1.618% – 2.618% of AB leg
The Crab Pattern
This pattern was also developed by Scott Carney, who claims it’s the most effective harmonic patterns to use when trading. It is a reversal pattern consisting of four legs marked X-A, A-B, B-C and C-D.
According to Carney, one main advantage of using the Crab pattern instead of other types of harmonic patterns is, the high risk/reward ratio because these set ups allow you to have very tight stop losses.
It allows traders to enter the market at extreme lows or highs.
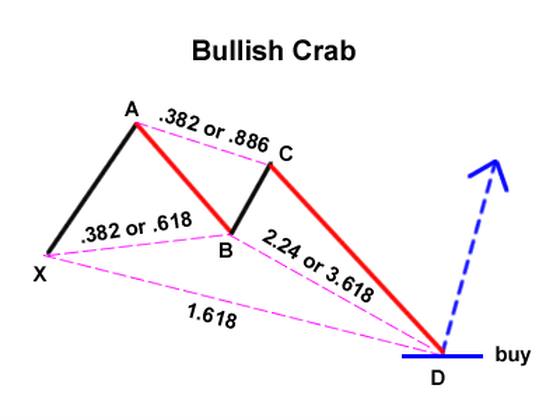
Crab patterns must follow these rules:
- AB should retrace between 38.2% – 61.8% of XA leg
- BC should retrace between 38.2% – 88.6% of AB leg
- C should never exceed point A’s high (or low)
- CD is the longest leg and it should extend to 161.8% of XA. CD can extend between 224.0% – 361.8% of BC leg in some extreme cases
The Cypher Pattern
The cypher pattern has five touchpoints and four waves or legs between them. Every touchpoint represents reversal levels, while each leg highlights a price action.
It uses tighter Fibonacci ratios (usually less than 1), thus creating a steeper visual appearance.


Cypher pattern rules:
A qualified cypher pattern is made up of an impulse leg (XA), followed by a retracement leg (AB) that reaches at least the 38.2% Fibonacci retracement of the XA leg without exceeding 61.8%.
When traded correctly, this advanced harmonic price action pattern can achieve a truly remarkable strike-rate and a pretty good average reward-to-risk ratio.
The Shark Pattern
The shark pattern is another type of harmonic pattern. It is one of the newer harmonic trading patterns and traders have been using since 2011.
The pattern got its name because its steep outside lines and shallow dip in the middle form a chart that looks like a dorsal fin.
Trading Harmonic Patterns
Trading Harmonic Patterns is similar to trading any other chart pattern.
Here are the main factors to consider:
- Practice trading these patterns in a simulator before using real money
- Always have a profit and loss target before entering the trade
- Establish where each patterns entry and exit points are
- Only trade A+ setups
Bottom Line
Every trader wants to become successful at trading. Learning to trade the market using harmonic patterns is not hard. They are one of the most useful patterns if plotted correctly.
However, don’t forget that harmonic trading has some inherent pitfalls and it is a rules-based method which requires discipline.
To make harmonic patterns more reliable, make sure to pay attention to support and resistance levels. Combine this with price action reversal patterns such as bullish or bearish engulfing to give yourself some confidence.
Finally, remember to set your stop losses and target levels to reasonable price levels.