

Technical trading is such a diverse method of trading that you really can’t pigeonhole it. There’s trend traders, mean reversion traders, breakout traders, and pullback traders.
You can trade support and resistance levels, forecast volume and volatility, or even do technical analysis on the VIX or the Federal Reserve’s balance sheet (maybe that’s not a great idea though!). And the quality of said analysis varies very widely.
On a long or short enough time frame, there’s a technical trading strategy that correlates to nearly whatever intellectual non-technical trading/investing strategy you can find.
However, one thing that seems to be true, is that a good majority of technical traders aren’t well-versed in quantitative analysis.
And before you think I’m trying to convert you to the church of traders who data-mine in Python for peculiar AI-based trading edges, let me tell you a brief story…
The Value of Common Sense Qualitative Analysis
A blog I followed called Alpha Architect recently reviewed an academic study that concluded investors overshare SeekingAlpha articles on social media that are quantitative in nature (rich with numbers, facts, figures) and undershare articles that are qualitative in nature (something like “sentiment is way too bearish, I’m getting long, this is still a good company”).
And the reason the researchers found for this disparity is that people tend to share information on social media that reflects who they want to portray themselves to the world as.
Sharing quanty articles full of fancy charts and spreadsheets makes you look like a smart, calculating investor, while sharing seemingly simple minded articles might make you seem like a callous, ‘gut feel’ investor, which isn’t the image most people wish to portray.
What’s most interesting though, is that this study found that the qualitative SeekingAlpha articles actually had more signal–in other words the qualitative stock picks outperformed the quantitative stock picks by a large margin.
And I think that makes sense, because quantitative information is commoditized nowadays. Computers can scan through all of it and arbitrage away some of the obvious edges. But there’s a minority of investors that can use common sense and outthink the market without the use of supercomputers and algorithms.
How Quants Took Over Trading and Poker
So that’s my long winded way of saying, quantitative analysis is pretty overrated by retail traders. It’s not a holy grail, not by any means.
As a matter of fact, in the vast majority of cases, edges in quantitative trading are far smaller and instead focus on systematically placing the same type of trade over and over again to realize an edge over a large sample size, much in the way that a blackjack card counter does.
Good technical traders are more like scrappy poker players. They rely more on hard-and-fast rules about the game (the market) and try to sniff out strength or weakness in other players (traders). They might sit out and fold many hands (not make trades) until they have a good hand (A+ setup).
But in the last decade, the scrappy poker players like Phil Hellmuth have gotten wrecked by the quants of the poker world. Because the quants, while they might lack some intuition, gusto, and human psychology, they understand the math and structure of poker better than anyone.
So the scrappy guys either died out or were forced to adapt. And many did. Guys like Phil Hellmuth won’t win in the hardest online games, but he can still crush live tournaments as well as anyone and make millions doing it.
The same is true for traders.
Back in the 90s, point-and-click prop traders used to trade a slow version of what the HFT firms like Virtu and Citadel do today. Buy on the bid, sell on the offer. Take advantage of easy and obvious arbitrages like dual share classes, preferred stocks, etc. Pick off stale quotes, They might have made over a thousand trades a day.
But many of these easy and obvious trades are gone – because they’re the ones that the computers can easily understand. Instead of becoming high-frequency traders and trying to join the trading arms race, they adapted. They gave up their easy edges and began developing more ephemeral edges.
The competition changed when the quants came in and ate their lunch.
So they might’ve had to become the rich maniac who shorts GameStop (GME) on the backside of an obviously crowded trade in the $400s, or niched down into a less scalable version of the trades they used to do.
Adding Some Basic Quantitative Edges to Your Toolbox
So we don’t want to become the quants, but we can steal some of the basic edges they might be leaving on the table or underutilizing. These are things that you don’t need to code, do any spreadsheet work, or have special trading technology to utilize.
One of the most important things we can do as traders is understand the basics of quantitative and systematic trading edges.
Of course this is an endless rabbit hole to go down, so we’re going to just review some of the most basic, contemporary edges and we’ll give you some information on how to go a bit deeper later.
A few basic things we can look into are:
- Post earnings announcement drift (PEAD)
- Intraday momentum
- Overnight risk premium
A Word on the Financial Academic World
Day traders are no stranger to non-random price action. We know it and see it every morning and know that there is certainly non-random trend and mean reversion price action occurring in the markets everyday if you can find it. Although it’s probably more rare than we think it is in reality.
However, academics view things a bit differently. They’re taught the Chicago Business School line of thinking largely developed under financial academic legends like Eugene Fama, Myron Scholes, Fischer Black, Merton Miller, etc.
This school of thought is broadly taught that the market is a highly efficient random-walk. In other words, consistent returns in excess of the broad market returns for a given asset class should not be possible over a large sample size.
It’s difficult to describe how prevalent and foundational this view is, it’s the very basis of the study of financial academia. It really underpins nearly everything they do. Even papers published in 2021 about highly niche market microstructure topics still use the Fama-French model as their foundation of understanding financial markets.
And although there are endless quant, HFT and prop firms for which these market anomalies can describe a majority of their returns, academics are still hesitant to really come out and strongly break from the view.
And for good reason, because academic research isn’t about confirming biases or speculating on how the world seems to be based on a discretionary view.
Although the common sense, gut-feel, intuitive way of viewing financial markets tends to prevail among those who trade actively for any period of time, the academic world is about listening to said views and trying to test them empirically. If they find evidence to support it, they publish and get notoriety, if not, the data they have simply doesn’t support it, but it doesn’t fully refute it either.
It’s just a different way of looking at the world and it’s a very needed counterpoint to those who fall into the camp of viewing markets too deterministically.
Those who take this academic line of thinking too seriously, risk falling victim to the same pitfalls that musicians who overly rely on music theory and can’t “break the rules” and make something unconventional. But Picasso said “learn the rules like a pro, so you can break them like an artist.”
So the idea here is to introduce you to some academic research that empirically shows some of the robust trading edges out there. Should you go trade these as-is? No, that’d probably be naive as these studies aren’t made to be trading systems, but findings on how markets work. The idea here is to show you an idea of how markets generally work on a quantitative level.
Maybe some of these findings will confirm/explain some of your own research and qualitative findings and allow you to think deeper about finding more edges.
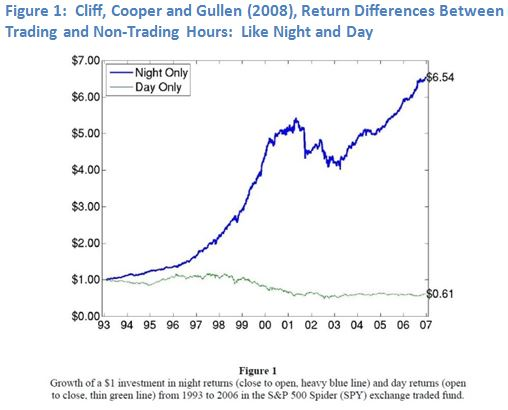
The Overnight Risk Premium
You get paid to hold stocks overnight.
There’s no free lunch in free markets and that axiom extends to day trading. As a day trader, you get the luxury of never being exposed to gap risk and are able to access liquidity at any time during your trade. Traders that hold overnight cannot simply choose to close their trade at 10PM ET.
It turns out that this luxury comes with a cost.
There’s a well-known “overnight premium” in holding stocks overnight. There’s more edge, in isolation (meaning without stock selection, trade management, etc.), in holding stocks close-to-open, rather than open-to-close. The effect is so strong, in fact, that overnight returns actually account for a massive percentage of equity returns over the last two decades or so.
Just take a look at this graph:
In addition to the constant liquidity and lack of gap risk that day traders enjoy, it’s also true that so much market-moving news like earnings reports and M&A-related announcements come out after the regular trading session, which is another factor that day traders benefit from.
With this anomaly in mind, cycling in some swing trades immediately comes to mind as a way to harness this edge, especially when it comes to large-caps, which are generally pretty low volatility intraday.
This is a market anomaly just discovered pretty recently, in a study by Branch and Ma called The Overnight Return, One More Anomaly, published in 2006.
Intraday Momentum
One of the strongest effects found in the realm of intraday momentum can be broadly described as “the first half-hour of trading predicts the last half-hour,” meaning that the directional price action at the open follows through at the close.
As day traders well know, intraday volume and volatility (which are strongly correlated) follow a u-shaped curve, meaning the majority of volume and volatility are concentrated during the first and last half hours of the regular trading session. These are the periods that “matter” most.
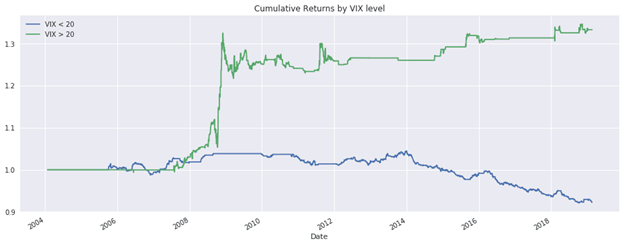
A commercial python-based backtester called QuantRocket backtested the strategy on their blog and found some favorable results:

Which they significantly improved by adding a VIX filter and only trading when the VIX is above 20:
Post Earnings Announcement Drift (PEAD)
The PEAD effect is one of the oldest and most robust market anomalies in existence. Its discovery tracks back to 1968, when Ball and Brown published it.
The idea is that stocks tend to trend in the direction of their earnings report in the weeks and months following reporting. In other words, if a stock reports bullish earnings, it should continue to trend for weeks or months even after reporting. The same is true of bearish reports.
This flies in the face of the efficient market hypothesis, and it caused quite a stir among EMH proponents when these findings were originally published. The EMH holds that any piece of information like earnings is nearly immediately incorporated into the price of the stock, allowing for no arbitrage.
The findings still hold today, when computers can scan and interpret earnings reports in less than a second and trade off of them. Rather than being a lag in investor reactions, there seems to be a systematic underreaction to positive and negative earnings reports initially which creates these post-earnings trends.
This is a wholly tradeable effect as well, as even rigorous quants who are highly skeptical of discretionary trading, like Euan Sinclair, counts it as one of his main trade setups.
This is the type of edge that you can start applying out of the box, as many traders already take advantage of it without knowing that it’s a well-studied phenomenon. After surprising earnings reports, many traders tend to take with-trend positions because of the momentum and technical chart setups they create.
Traders can take these trades with a bit more conviction going into the future as they know they’re harnessing an established source of returns.
Bottom Line
As short-term traders who are targeting returns much in excess of the average 8% or so average US stock market return, academic studies can be a bit intimidating.
Many of the researchers hold and publish beliefs that are at direct odds with your goals; i.e., that markets are efficient and excess returns are mostly the result of skill.
However, they’re just as curious about market anomalies and edges as you and I. But they’re part of the academic system and that’s the way they were taught.
With no disrespect due to academics, look to the countless prop traders, hedge fund managers, and individual traders who have absolutely crushed this idea of strong market efficiency for your motivation.
Don’t look for validation from academics who view markets in theoretical terms and often don’t trade themselves.