

The style of chart scaling you use on your price charts is one of those seemingly unimportant details that can dramatically affect how you perceive market action.
Linear vs Logarithmic scaling are the two primary chart scaling styles, and both are available in almost every charting platform.
The Difference Between Linear and Logarithmic Charts
On a linear chart, each unit change is treated exactly the same. The change from $1 to $2 looks the same from $10 to $11.
On a logarithmic chart, each percentage change is treated the same.
Linear charts become useful when you want to see the pure price changes with scaling calculations. Day traders often prefer linear charts.
Logarithmic charts are useful when viewing long-term charts. Over the long-term, large price changes are made, which a linear chart can distort. Log charts are also important in the context of exponential growth.
Here’s an example of the 2017 Bitcoin bubble, viewed on both a linear chart (bottom) and a logarithmic chart (top).
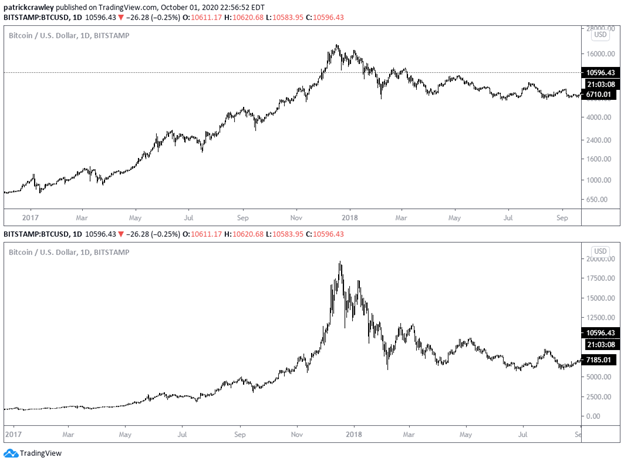
Logarithmic Charts Explained
In a nutshell, logarithmic charts show percentage changes in a linear fashion.
That’s a mouthful, but it’s easy to understand when simplified. The size of the line on a logarithmic chart when the same stock on the same chart goes from $1 to $2 will be the same as when it goes from $100 to $200.
Percentage changes are represented equally, regardless of the price.
These charts help put large dollar moves in context. If a stock starts at $1 and ends up at $100 a few years later, a linear chart will make it look like the stock went parabolic recently because the chart began at $1.
Logarithmic charts become useful when analyzing exponential growth.
An easy rule of thumb is to use a log chart once a security has doubled on the chart. Linear charts serve to mislead on exponentially growing securities.
Let’s take a look at an example in an explosively trending stock, Shopify (SHOP).
Shopify stock has gone up in an almost straight line since its 2015 IPO, where it opened for $28 per share.
At today’s price of over $1,000, viewing a linear chart can heavily distort the recent price action.
As you can see, in the linear chart (top), the price move from $500 to $1,000 looks much more significant than the move from $100 to $500, even though the former is only a 100% increase, compared to the latter’s 500% increase.

Now, if you look at the logarithmic chart (bottom), you can see a more accurate representation of what SHOP actually did over the last few years.
Linear Charts Explained
Linear scaling is precisely what it sounds like. To quote One Minute Economics, “a unit is a unit” on a linear chart.
The price change from $1 to $2 is represented in the same way that the price change from $100 to $101. In the former case, the stock doubled, while the stock only moved up one percent in the latter case.
This can create problems for securities that have multiplied in price.
In effect, linear charts underrepresent price changes made when the security price is low (relative to the rest of the prices on the chart) and over-representing price changes when the security price is relatively high.
Take the below linear chart of Zoom (ZM), for example.
The price action in the marked-blue zone looks pretty boring like not much happened. In reality, this is the curse of using a linear chart on either a long timeframe or once a security has doubled on the chart.
Because ZM was cheaper (between $40 and $120) in the marked-zone, the price changes look insignificant.

When to Use Logarithmic Charts
Pure dollar moves hardly matter in financial markets. Adjusting for volatility or even percentages at least frames it in context.
This is why I think using logarithmic charts for most intermediate-to-long-term purposes makes the most sense.
The move from $50 to $55 is, on a percentage basis, the same as the move from $75 to $82.50. So why not allow your chart to account for these things automatically?
In less volatile stocks on short-to-intermediate term charts, the scaling method you use doesn’t matter. If you change from linear to log, you won’t realize much of a difference.
Here’s an example in Johnson & Johnson (JNJ), low-volatility stock. Can you even tell the difference between the two? For reference, the bottom is a linear chart, and the top is a logarithmic chart.

I think it makes sense to use linear charts in most day trading circumstances to get the purest representation of price changes.
Trendlines vs. Chart Scaling
Trendlines are one of the most popular charting tools, used in both modern and classical technical analysis. However, they too can be distorted by chart scaling. Does this call the utility of trendlines into question?
Not necessarily, but it’s good to be aware of how scaling shapes your perceptions.
Here’s an experiment. Open your charting platform and pull up a linear chart of any trending security. Draw a trendline, then change the scaling to logarithmic.
Here’s what I’m talking about.
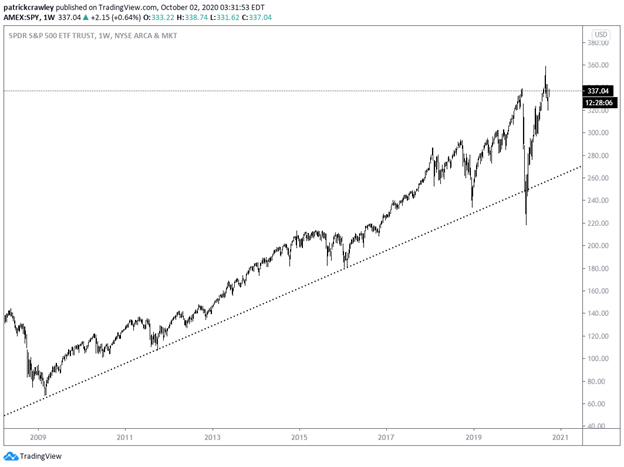
Look below at the weekly linear chart of SPY, with a trendline. The 2009 lows were connected to the 2015 swing low. The trendline was clearly broken in March 2020 when the market crashed.
Here’s what the same exact chart with the same trendline looks like with logarithmic scaling:
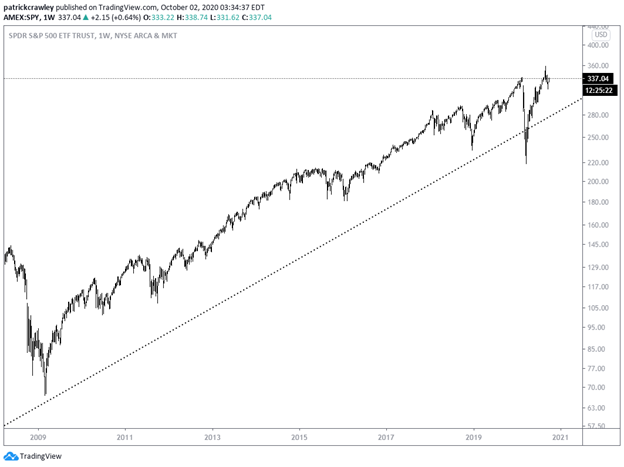
The initial start of the trendline at the 2009 lows doesn’t even touch the trendline anymore, nor do the 2015 lows.
In light of this, how should we think about trendlines?
Firstly, I think it sheds light on the importance of being consistent in your charting. You should have a protocol for your charting tools. Perhaps you’re all linear, or all logarithmic while being aware of the flaws inherent in each style.
You might choose to use logarithmic for inter-day (daily+) charts and linear for intraday. But be consistent, or else you’ll run into problems.
Trendlines serve to give us an idea about the rate of change of a trend.
All we’re doing when we connect a trendline is just connecting significant pivot points. When a market begins to outpace a trendline significantly, something has changed. Conversely, when a market breaks through a trendline, the trend rate has slowed.
So precise trendlines don’t matter so much because they’re a rough, qualitative tool.
Bottom Line
Chart scaling can distort your perceptions of certain trading situations.
Linear charts, for example, can serve to mess with your perceptions regarding strongly trending stocks. It can make a reasonably strong trend look like another Bitcoin bubble under the circumstances.
On the other hand, a logarithmic chart can do the same thing. As you saw in the Bitcoin bubble in the early example, they can perceptually underplay what is actually an explosive price move.
The solution is to understand how your charts are calculated and know why you’re using the scaling method you’re using.