

Almost every trading strategy aims to exploit one of two prevailing phenomena in financial markets: mean reversion or momentum.
In a nutshell, mean reversion strategies assume big moves will partly reverse, while momentum strategies assume big moves will continue in the same direction.
This article will explain the phenomenon of mean reversion in stock prices.
What is Mean Reversion?
In mathematical terms, the financial concept of mean reversion is better known as “regression to the mean,” which refers to the likelihood of a deviated dataset to revert back to the mean.
In other words, if you flip a coin twenty times and all twenty flips result in heads, if you were to do another 10,000 coin flips, it would be extremely likely for the rate of heads occurrences to regress to nearly 50%.
Financial mean reversion is similar but is more ephemeral.
Mean reversion strategies have an underlying assumption that a historical mean of some sort has significance; that considerably deviating from that mean in short order makes it more likely for the security to bounce in the opposite direction.
However, you’ll find that many mean reversion traders don’t actually believe that any historical mean holds significance.
Instead, many view them as convenient reference points. If a stock is three standard deviations away from its 10-day mean, that’s an indicator that it just made a large upside move. And there are potentially profitable signals to be gleaned from that.
As a generality, stocks, and indices in particular, have a strong tendency to mean revert, as opposed to commodities and currencies, which tend to trend more.
But why is this?
The academic literature raises many potential explanations, but I think leverage and margin make the most sense.
When trading stocks, the margin requirements are high.
You typically need to commit at least 25% in margin to the position, making stock trading systems capital intensive.
Compare this to the futures markets, where maintenance margin requirements are routinely less than 10% of the contract’s notional value. Similarly, significant leverage is available in the forex markets.
So why is this significant?
When your stock positions are cash-secured, your exposure levels to individual positions increase significantly when those positions grow in value.
This necessitates rebalancing, which creates selling pressure in the best-performing stocks as they continue to outperform.
Contrast this to commodity and currencies, where even highly leveraged portfolios only utilize a fraction of their total cash. It becomes easier to understand why there’s less friction to the occurrence of trends in these markets.
Mean reversion strategies fade large deviations from historical prices. Buying stocks at 52-week lows is a simple example, while a statistical arbitrage pairs-trading system is more complex.
The 52-week low strategy assumes that the stocks have been sold indiscriminately and are due for a bounce back to some historical mean. The idea here is that the stocks have simply gone down too much.
A pairs-trading strategy, whether it’s based on the relationship between two similar companies, or even between two shares classes of the same stock, assumes that you can profitably trade when there’s a significant deviation from the historical correlation.
Stocks Tend to Mean Revert
The academic evidence for the mean-reverting tendency of stocks abound.
Among the major findings, one of the more interesting conclusions is that momentum and mean reversion can perfectly coexist in the stock market.
In other words, the strategy of joining or fading the stock market’s biggest winners can both be potentially profitable systems.
This is because outperformance tends to persist in the intermediate-term and reverse in the longer-term. At a certain point, at around the 3-5-year point, buying the market’s biggest losers actually outperforms that period’s winners.
Why Mean Reversion Occurs in Stocks
A quick thought experiment.
You’re applying a standard momentum strategy to US stocks. It ranks the stocks in your universe based on their risk-adjusted momentum.
You buy the highest-ranked stocks on the list, manage risk using a risk parity framework, and rebalance each month.
Each time you rebalance, you’re going to have some positions which performed very well and grew in value. To stay consistent with your risk parity framework, you have to reduce your position size in these stocks, even though they’re your best performers.
Now assume that most equity momentum strategies are very similar because they basically are. Most of your peers trading the same style will probably own those same high-flying stocks and will also have to trim their position sizes when they rebalance too.
Eventually, all of this selling pressure will combine with an actual shift in market dynamics to bring it closer to its historical ‘mean’.
This specific situation isn’t alone in its responsibility for the mean-reverting tendencies of stocks, but it’s a good way to demonstrate it.
Directional vs. Relationship Mean Reversion
Mean reversion is a catch-all for many different strategies that all share the common trait of fading deviations from a historical mean.
That mean is frequently price, but it can also be a measure of valuation or similar fundamental indicators.
Directional Mean Reversion
Directional mean reversion strategies involve projecting a directional price move in a specific security.
For example, if Apple stock falls two standard deviations from it’s 90-day linear regression, we might expect the net returns in those situations to lean positive.
There’s many different ways to devise a mean reversion system, whether it’s consecutive closes, a deviation from an average, or an indicator value. All of them essentially boil down to “buy when a stock drops too much” or “sell when a stock has increased too much.”
Relationship Mean Reversion
Most professional mean reversion traders don’t trade directionally. Instead, they trade the relationships between securities. A simple example is statistical arbitrage between two share classes.
In most cases, both shares have nearly identical intrinsic value and should be trading at the same value.
When dislocations in these share prices occur, pairs-traders will buy the cheaper share and sell the more expensive share, betting that the delta between the two will tighten.
Here’s a simple example of a correlation chart between two closely related stocks: Pepsi and Coca-Cola:
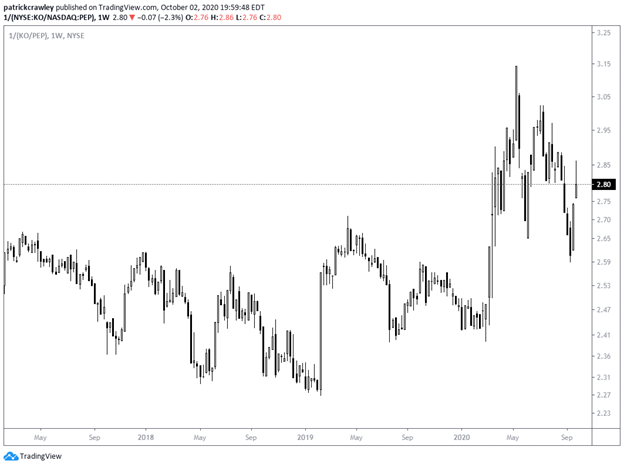
Traders might devise a system to buy the cheaper and sell the more expensive stock when the delta between the two stocks considerably widens.
To keep things simple, though, we’re going to focus on directional mean reversion strategies.
Types of Directional Mean Reversion Strategies
Technical Indicators
By far, the most popular way to trade mean reversion is using basic technical tools and building a rules-based system around them.
The signals given by each system are pretty correlated, so it doesn’t matter too much which tool you choose to use, but instead how you apply it and manage risk.
Linear Regression
A linear regression line will fit the best line between both the starting and ending points.
Without getting into the math behind it, think of it like a trendline that cuts prices. It’s the trajectory a security took to get from point A to point B.
See the chart of Goodyear (GT) below as an example:
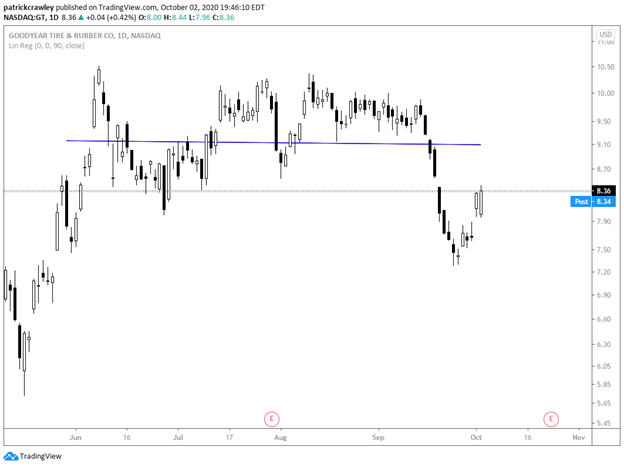
Above is a 90-day linear regression line. The line represents the best fit between point A (90 periods from today) and point B (today), which represents basically a sideways line.
This just tells us that on balance, Goodyear has been range-bound over the last 90 days of trading.
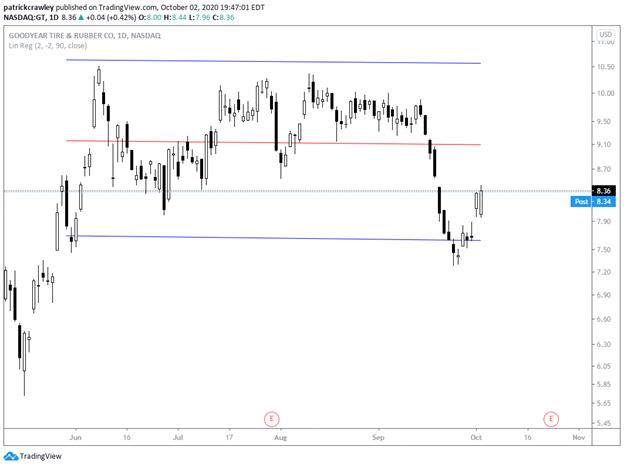
A typical mean reversion trading tactic is to plot standard deviations around the linear regression line. The security is considered overbought when near the upper range and oversold when near the lower range. See the below chart as an example:
Trading Bands
Trading bands like Keltner Channels and Bollinger Bands are some of the most commonly applied technical indicators for mean reversion strategies.
These are generally useful when the price action inside the bands is considered ‘normal’, and action outside the bands is considered ‘abnormal.’
Just as when using linear regression, significant deviations from the trading bands present fading opportunities to take the opposite side of the trend.
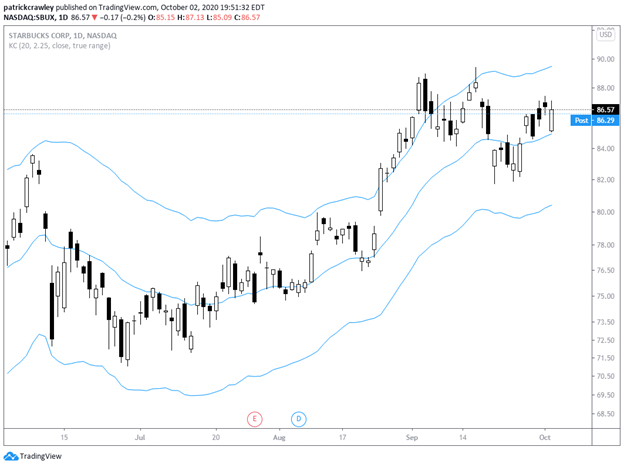
Here’s an example chart of Starbucks (SBUX) with Keltner Channels. Shorter-term traders are likely to find these more useful because they’re quick to adapt to recent prices.
ConnorsRSI
ConnorsRSI is a modified short-term RSI developed by Connors Research. It’s a combination of three different indicators:
- A 3-period RSI
- An RSI applied to the current up/down streak of the market (i.e., 5 consecutive positive closes)
- Rate of change
Each of these factors is equally weighted to form a sort of adjusted-RSI that not only identifies short-term overbought and overbought levels but also weighs the levels against factors that point the odds further in your favor.
The indicator’s calculation gives readings stronger conviction when the rate of change and up/down streaks are at extremes. These factors provide short-term mean reversion trades a higher expectancy.
Here’s the formula for calculating the indicator:
ConnorsRSI(3,2,100) = [ RSI(Close,3) + RSI(Streak,2) + PercentRank(100) ] / 3
The basic rules outlined by Connors Research are as follows:
- Buy when the ConnorsRSI < 20 (or 15, 10, etc.)
- Close the position when the stock closes above the 5-day moving average or when the ConnorsRSI is above 65.
Here’s an example of what a long setup for ConnorsRSI strategies might be:
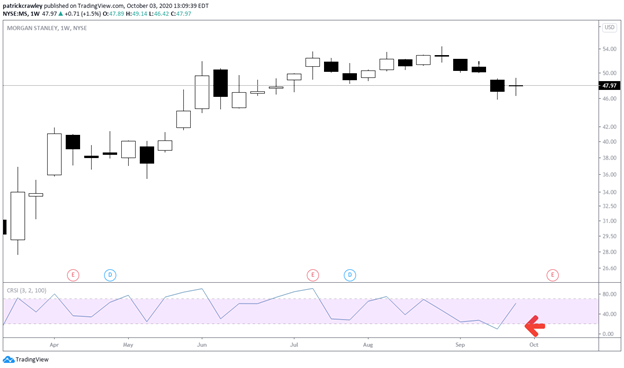
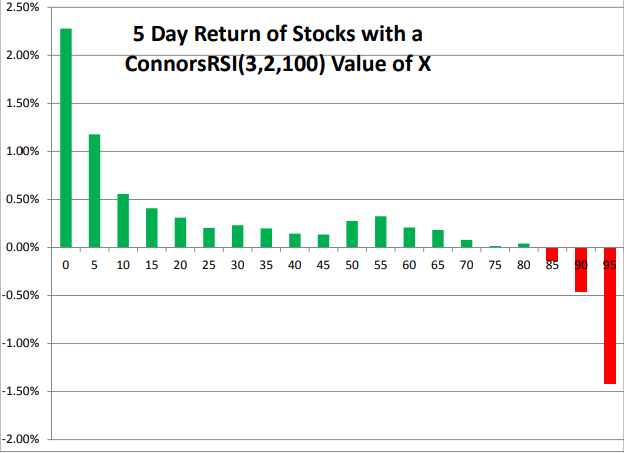
There’s been a wealth of quantitative work done on this indicator, much of which can be publicly found on sites like Quantopian and the like. Below is a graph showing the 5-day returns of different ConnorsRSI readings.
As expected, the extreme oversold conditions present the most favorable opportunities, likely because the proverbial ‘rubber-band’ is stretched so far that, even if the market continues to decline, it still has to bounce in the opposite direction, at least in the short-term:
Bottom Line
Mean reversion trading is psychologically difficult.
You’re buying falling knives, which may continue to fall precipitously, without a bounce, while your profit target is small. Worse, most mean reversion traders don’t typically use stop losses because they negatively affect trade expectancy.
By all accounts, learning trend-following or momentum is a much more comfortable and psychologically pleasing way to trade. You’re on the right side of the trend, often have a reasonably tight stop, and your winners tend to be much larger than your losing trades.
However, mean reversion trading can be highly rewarding precisely because it’s difficult and a less “crowded trade.”