

Many of the best day traders in the world use momentum indicators and achieve outstanding results every year.
Momentum traders assume the broader stock market is right and stocks that have shown a recent pattern of upward or downward movement will continue their path. To summarize a well-known phrase among traders, “the trend is your friend.”
The advantage of momentum indicators is the fact that they work in all markets, and their simple use and easy duplicability. There plenty of many successful traders who have made or continue to make remarkable profits, thanks in part to these indicators.
In the following paragraphs, we will discuss the momentum indicator, including what it is, how to use, among other things.
What Is Momentum Indicator (MOM)?
The momentum indicator is a tool that traders use to determine the momentum that a financial instrument (stock, options, futures, currencies, etc) has when it is gaining or falling in the market.
Simply put, momentum indicator compares the current price with the previous price from a given number of periods ago.
Calculation
In his book Technical Analysis of the Financial Markets, former technical analyst for CNBC, John J. Murphy says that “market momentum is measured by continually taking price differences for a fixed time interval.”
Murphy goes on to say that to construct a 10-day momentum line, one simply need to “subtract the closing price 10 days ago from the last closing price. This positive or negative value is then plotted around a zero line.”
Therefore, while there are numerous charting software tools and trading platforms that traders can use to calculate momentum for a stock, the simplest calculation of momentum is as follows:
Momentum = (Current closing price)- (Closing price n periods ago)
Where:
n = the number of periods the trader selects
Important Momentum Indicators For Day Traders
While there are plenty of momentum indicators that you can use, we have picked a few that are widely used and very popular with day traders.
Rate of change is a mathematics concept that displays how one value changes compared to another. Traders use this momentum indicator to compare price changes to each other.
The relative strength index was developed in the 1970s by Welles Wilder. The technical analyst known laid out his calculation for the indicator in his book New Concepts in Technical Trading Systems.
The RSI is deemed to be a momentum indicator because it compares the current price change to recent price changes. A higher reading, implies a faster change in price.
The moving average convergence divergence is an indicator that hovers around zero. It is a measure of both momentum and trend.
The calculation of this indicator follows the same logic as a simple moving average, but integrates additional features to provide a better view of a more current moving average compared to an older one.
When this indicator crosses over into positive territory, traders view this as a buy signal, When it crosses into negative territory, it is seen as a sell signal.
Traders who like to follow trend, usually use this indicator to complement other technical analysis tools, and not as a stand-alone indicator.
How To Use Momentum Indicators
If there is one thing we can agree on, stock traders are very predictable. Bullish traders continue to ride the momentum higher and are possibly heading for some sort of destructive ending.
In contrast, bearish traders fight the trend and the tape, missing opportunity after opportunity when it looks like the market is ready to break.
Momentum is a formal way to capture two of the most common momentum maxims: “The trend is your friend until the end when it bends” and “let your winners run.”
It can be measured over any time frame from microseconds to years, but day traders typically use small time frames like the 1 minute; 5 minutes; 10 minutes; 15 minutes; 30 minutes; or 1 hour. Day traders rarely (but do occasionally) watch prior days.
Some online brokers also offer tools that can help traders to know when momentum builds so they don’t end up on the bad side of the trade.
For example, TD Ameritrade’s thinkorswim platform has a tool known as TTM Squeeze that you can use to highlight when the transition between a trend and a consolidation is likely to happen.
Example
Below is a chart with momentum plotted against the price movements of the S&P 500. Some traders consider the SPX to be a more accurate measure of momentum in the markets as a whole because it is value-weighted and has broad representation.
For illustrative purposes, this chart is only the momentum for the SPX and does not include the prices from the index.
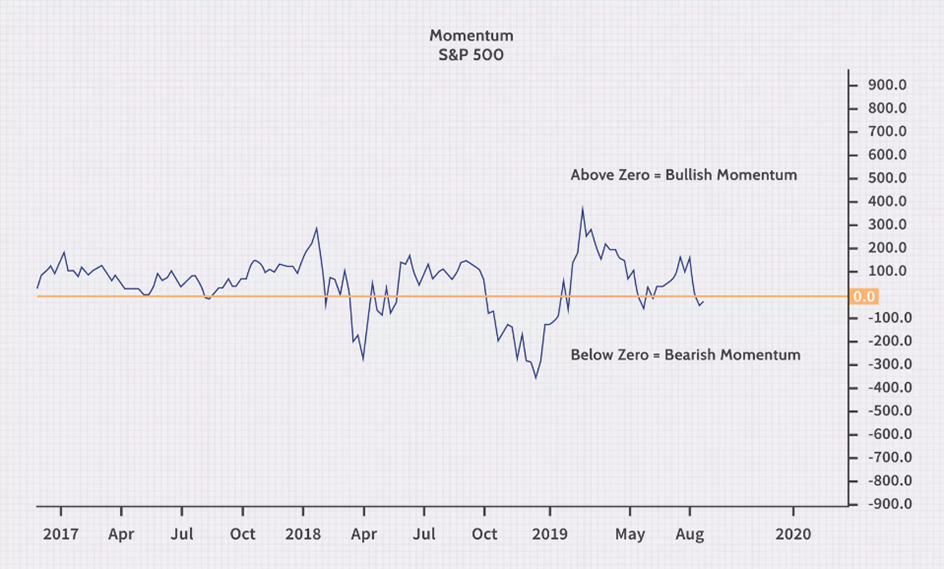
If the current closing price is less than the closing price 10 trading days ago, the negative number (from the formula) is plotted below the zero line.
Conversely, if the latest closing price of the SPX is higher than the closing price 10 days ago, the positive measurement is plotted above the zero line.
Basically, the zero line is an area where the stock or index has no trend or likely trading sideways. Once the momentum of a stock has built up (whether it is bearish or bullish) the yellow line (momentum line) moves farther away from the blue line (zero line).
Bottom Line
Day trading is all about momentum. One of thing we can all agree on is that the best way day traders can make decent profits is by finding stocks that are moving.
The fact of the matter is that almost every single day there is a stock that will make 20-30% move or even more! This is where momentum indicators come in. Traders use these indicators to help them find those stocks before they make the big move.
Momentum indicators are a good indicator for identifying price movements and ensuing trend development.
However, one thing to keep in mind when using these indicators is that it is not magical and does not guarantee a 100% success rate.
Momentum is something that you need to take into account with other technical and fundamental analysis tools when evaluating trends in the markets.