
One of our favorite strategies is the Reversal Day Trading Strategy. This Strategy Complements our Momentum Day Trading Strategies.
We apply the Reversal Strategy for both Day Trading and Swing Trading.
The primary reason I like our Reversal Day Trading Strategy is because it gives us the opportunity to enter a stock very close to support.
You may have heard the sold saying, buy low – sell high. Well this is certainly easier said than done.
As traders we want to find the opportunity to take a position on a stock near a support level. This gives us a good place on the chart to set our stops.
What is a Reversal Day Trading Strategy?
At its simplest, a reversal strategy aims to profit from the reversal of trends in markets. If the S&P 500 has been rallying for months, and a trader spots a signal that a sell-off is coming, then they are aiming to profit from the reversal of that bull trend.
Most of the time, when a trend ends, the market ends up consolidating in a range for a period before a new trend begins.
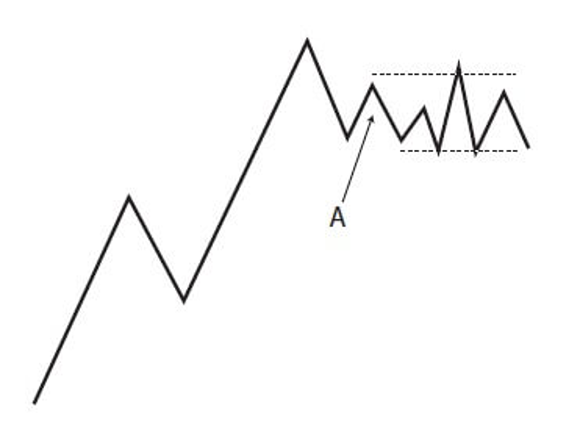
At the end of an uptrend, you typically see a loss of steam and volume, as well as lower highs before the market settles into a tight range. It’s commonly after the downside break of this range that we see the actual “reversal” that many traders are looking for.
Here’s what most trend terminations look like:
 I didn’t pull this theory out of a hat. It’s supported by not only one of the most respected technicians in history, Richard Wyckoff, but also has been validated through gigabytes. He didn’t just study S&P prices, he has tested his patterns on “Equities in the 1700-1800s, grain prices in Europe in the 1300s, and, perhaps to the point of absurdity, to the price of dates and barley in ancient Babylon!”
With that out of the way, this brings us to Richard Wyckoff and his concept of the Market Cycle.
Wyckoff’s market cycle has four stages: accumulation, markup, distribution, and markdown. See the graph below for a visual representation.
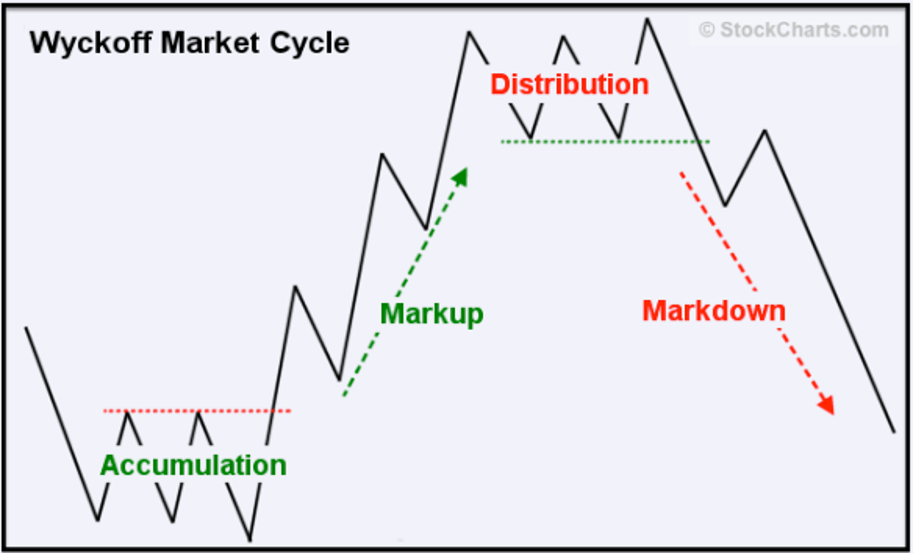 The premise behind the Wyckoff’s Market Cycle is that “smart money” manipulates the market so they can as early as possible and sell to the “dumb” retail money at just the right time. This ensures that retail is always holding the bag, and smart money captures the meat of the move.
At the core of this theory is that the market is that a few “Composite Operators,” highly informed traders and investors, almost completely control price and move the market at their will.
Accumulation is when the market is forming a base, supported by the quiet and careful buying of smart money.
On a price chart, accumulation looks like the market is trading in a range, mostly going nowhere. However, the Wyckoff practitioner can observe the subtle signals that smart money is buying.
Markup is when price breaks out of its accumulation range and enters an uptrend. According to Wyckoff, at this point, the composite operators have sufficiently accumulated their position. They are now ready to allow the market to auction higher, by essentially attracting the dumb money with a breakout.
Signs of a Reversal
In Wyckoff analysis, the two most crucial indicators are price and volume. While we may choose to apply others, these two should serve as our primary points of study.
The problem with identifying accumulation or distribution is distinguishing the difference between a random trading range and actual accumulation or distribution. One subtle sign Wyckoff analysts use are springs and upthrusts.
The Wyckoff Spring and Upthrust
Springs and upthrusts are the keys to distinguishing between a zone of accumulation/distribution and a random trading range. They occur when price momentarily trades outside of the range, only to be aggressively bought or sold back into the range.
In more modern jargon, you’ll hear a Wyckoff spring referred to as a failure test. The market is testing a break below the bottom of the range and is quickly rejected, indicating strong support.
Here’s an example from the S&P 500 in November 2008, a time when smart money actually was aggressively accumulating significant positions.

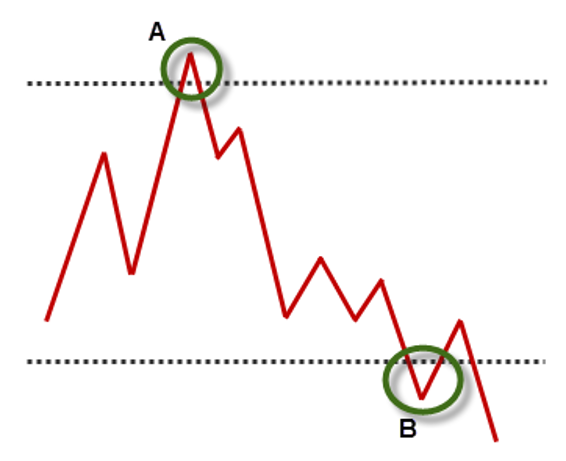
An upthrust is the same as a spring, except reversed. Instead of a failure test of the bottom range, it’s at the top range. In the same way that a spring may indicate a trend reversal to the upside, an upthrust may indicate a trend reversal to the downside.
Here’s an example of a successful upthrust and a failed spring pattern:
Reversals: Large-Cap vs. Low-Float Microcaps
Low-float momentum stocks do move differently than their large-cap counterparts, though. It’s not uncommon to see a parabolic run-up soon followed by a congruent sell-off. Let’s be honest; most runners that low-float day traders play are basically pump and dumps.
There isn’t usually an underlying fundamental change in value driving the rallies, rather a strategically timed press release or promotion coinciding with the announcement of a capital raise or the conversion of a note into equity.
This isn’t always the case, of course, but you should be inherently skeptical of parabolic runs in microcaps.
Here’s a dramatic look at how compressed the trend reversals within a low-float stock can be. The trend both climaxed and wholly reversed in a week’s time.

In contrast, here’s a more typical example of a trend reversal. Observe how it took Apple about two months from the time of its trend climax, to the actual breakdown of distribution.

Graphs like the HMNY example above show how rampant speculation, manipulation, and FOMO are in the low-float market, as compared to the much more tame market of large-caps.
Indicators That Help Spot Reversals
I’m going to assume you’re trading a parabolic low-float stock, the stocks that most WT members prefer. For large-cap and assets that move slower, study the Wyckoff market cycle.
When trading reversals in parabolic stocks, I’m assuming that you’re trying to trade them from the short side. These stocks hardly go down exponentially, only to come back up days later, so the primary people tend to trade reversals on these stocks is on the short side. With that settled, let’s move forward.
A parable I trade by is that “momentum precedes price,” I’m not sure who was the first to say it, but it’s a core principle. It means that momentum, or the propensity of the market participants to move price aggressively in one direction, comes before the change in trend becomes apparent.
There’s many ways to identify a momentum divergence, but a straightforward technique is to exercise caution when price makes a new high, but a momentum oscillator like MACD doesn’t register a new high. Of course, this isn’t foolproof, but I’ve found it to be a simple way to spot a red flag quickly.
Here’s an example in a current runner, SNGX. The stock has shown lots of steam and has been running up all month. However, we see significant resistance around the $3.00 level, and the stock can’t seem to hold above the level for now. After a three-day sell-off, we can see that the stock caught a bid today (the time of this writing).
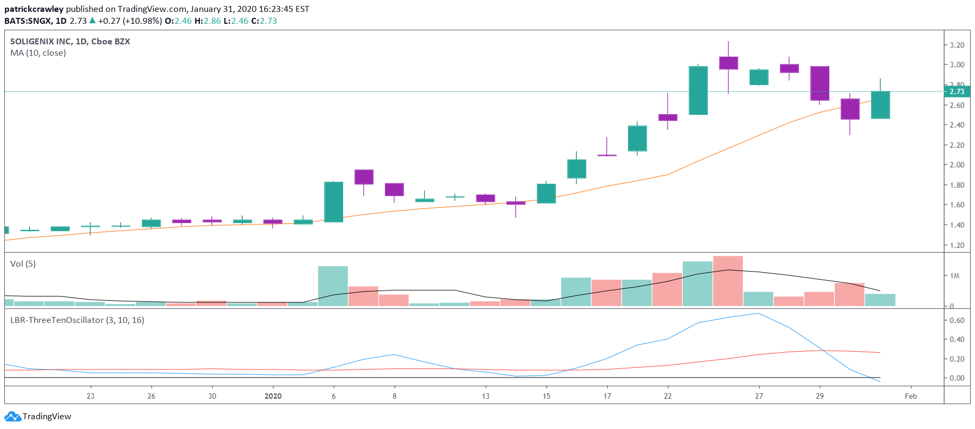
To many, this would seem like a sign that the stock may be preparing for another run, but there are a few warning signs that would either (a) stay out of the stock completely, or (b) look for short-selling setups.
The first red flag here is the low relative volume on the first green day after three previous bearish days. The stock failed to penetrate it’s declining 5-day volume average. The strongest leading stocks attract more volume when they’re advancing and less when they’re declining.
The next sign is an apparent loss of short-term momentum. As you can see on the 3-10 oscillator, which is just a modified MACD, the slow-line has flattened while the fast-line has lost its steam and crossed below the slow-line, a significant warning sign. We also didn’t see any action from the oscillator as a result of today’s semi-bullish market action.
From a Wyckoffian perspective, the stock could be entering a distribution zone as the smart money liquidates, leaving retail to hold the bag. In these microcap runners, the moves are so compressed, time-wise, that fewer data points are created, making it more difficult to identify each point in the cycle until after the fact. This could simply be a pullback in a continued uptrend or a top forming.
Of course, these technical signals are coming from the perspective of a short-term momentum trader. I have no idea where the stock is going. These are just reasons that indicate to me that the trend might be reversing and that alert me to be extra careful on the long side.
What We Look for in Reversals
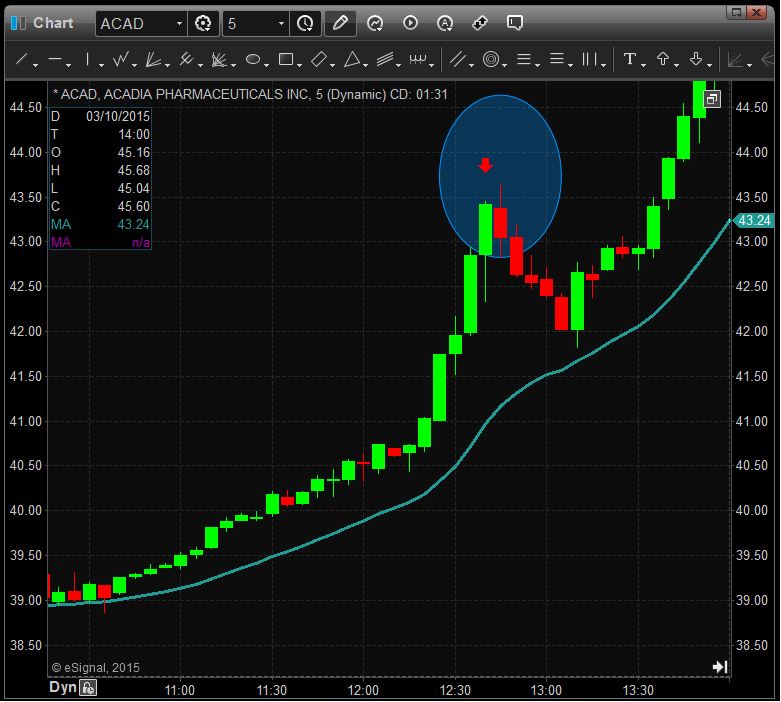
Criteria for a reversal stock candidate
- I look for stocks hitting new highs or new lows
- I look for at least 5-10 consecutive 5min candles of the same color
- I look for RSI below 10 or above 90 to indicate extreme conditions
- I think of these stocks as a rubber band, the more stretched out it is, the better the snap back potential
- I look to buy the first candle that begins to reverse with a stop either at the high/low or minus 20 cents
- I use trailing stops to keep myself in these winning trades as long as possible
Tips for Managing Risk
It’s tempting to place your stop just above an area of distribution, or just below an area of accumulation. The problem is that these areas can only be roughly defined. Support and resistance levels are hardly at an exact point like $323.54, but more like an area around a level, with the wideness of that area depending on the volatility of the stock.
Let’s take an example in a mega-cap, Boeing. Below is a chart of Boeing (BA), illustrating what I’m talking about. BA is entering what looks like a period of distribution, where the “composite operators” are beginning to offload their shares onto the public.
Just by glancing at the chart, you can observe that the range is there, but it isn’t neat by any means. We see a few highs around $360, $380, and even $400.
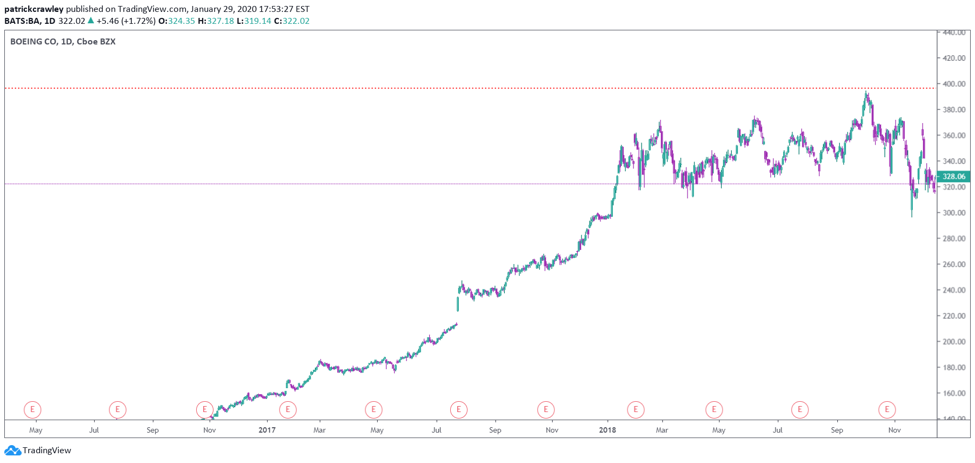
A novice might see this chart and decide to place his stop at $401, just above what seems to be the point of resistance. See the next chart of Boeing below to see the typical fate of the trader who can’t grasp that support and resistance levels aren’t exact price points.
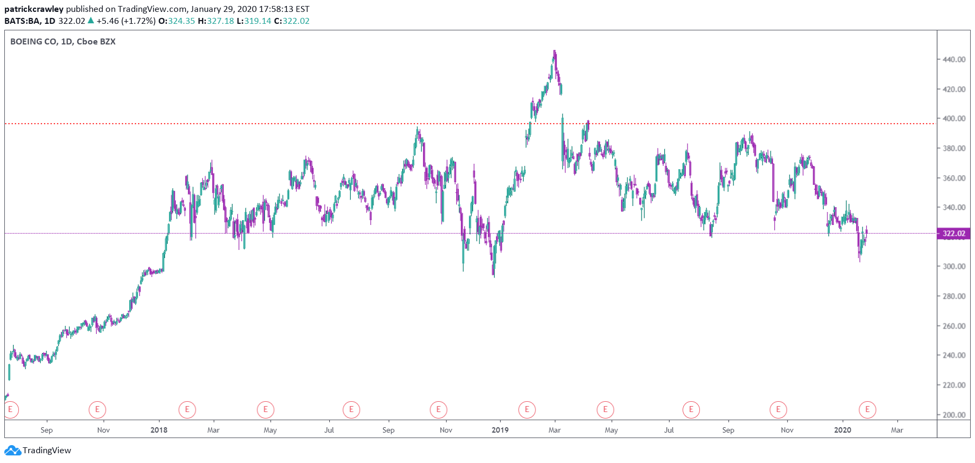
Admittedly, most traders who took sold Boeing short in the distribution zone before it’s run to $440 were stopped out, but that’s not the point.
Final Thoughts
Reversals are some of the trickiest setups to trade. They unfold differently in each asset class, and according to the current market sentiment.
While they can reward us hugely, being wrong in a reversal trade can be quite painful. Nobody likes being on the wrong side of an aggressive trend.
In my opinion, trading reversals is best suited for traders who have some experience, especially with reading the tape. And, as always, this strategy should be practiced in a simulator before risking real money!