

One of the most effective setups for profitable trading opportunities is the rising wedge pattern.
Wedges form as a stock’s price movements tighten between two sloping trend lines that are drawn like a triangle.
Many day traders are probably already familiar with rising wedge patterns (opposite of falling wedge patterns) as they are quite common in the stock market as well as futures and foreign exchange markets.
The rising wedge, also known as ascending wedge, can be incredibly reliable and has the potential to generate huge profits if traded correctly as we explain in this blog post.
Rising Wedge – What is it?
A rising wedge is a bearish stock pattern that begins wide at the bottom and contracts as trading range narrows and the prices move higher.
This indicates slowing momentum and it usually precedes a reversal to the downside, meaning that traders can identify potential selling opportunities.
It is characterized by a trend line caught between two upward diagonal price trend lines of support and resistance that move in a converging pattern. The upper line is the resistance line, while the lower line is the support line.
Rising wedges signal a bearish reversal, because they are usually immediately followed by a downward price trend. Falling wedges, on the other hand, signal a bullish reversal in the prices of securities.
A rising wedge can also fit into the continuation category.
In this case, it will still slope up, though the slope will be against the prevailing downtrend. Irrespective of the type (continuation or reversal), rising wedge patterns are bearish.
Why it Forms
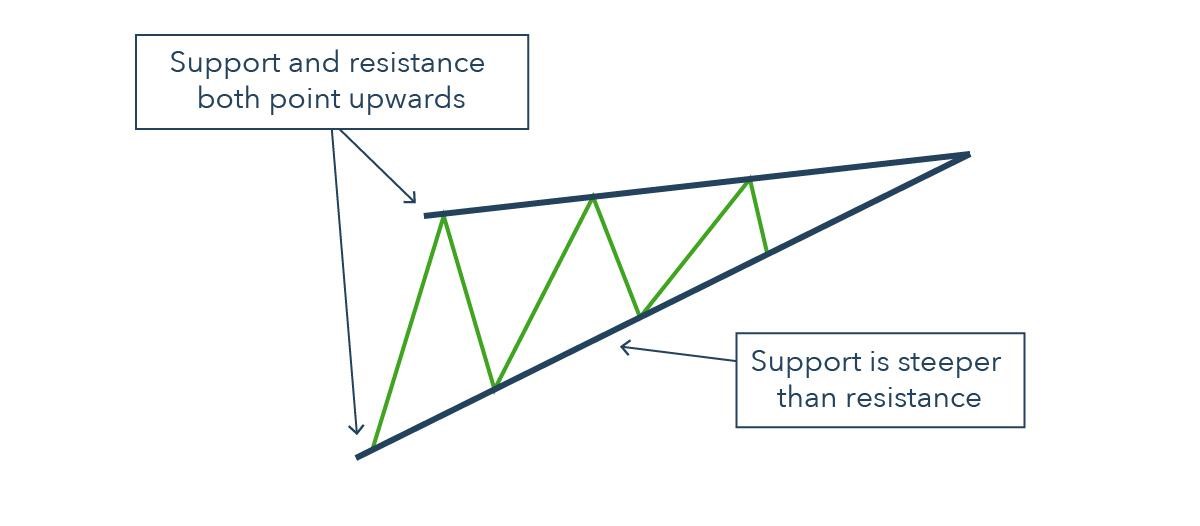
The rising wedge chart pattern forms when a stock consolidates between two converging support and resistance lines.
In this case, the support and resistance lines both have to point in an upwards direction and the support line has to be steeper than resistance line.
Rising wedges can form when a stock is in an uptrend or downtrend:
- When a stock is rising, they are a sign that traders are reconsidering the bull move.
- When a stock is in a downtrend falling, they are a short-term pause before the bear market takes hold once more.
Identifying a Rising Wedge Pattern
As earlier mentioned, rising wedge patterns hint towards a bearish market. When the wedge aligns itself with the current trend, the probability is on the side of a market reversal.
However, if the wedge is pointing against the trend, the probability lies on the side of a continuation.

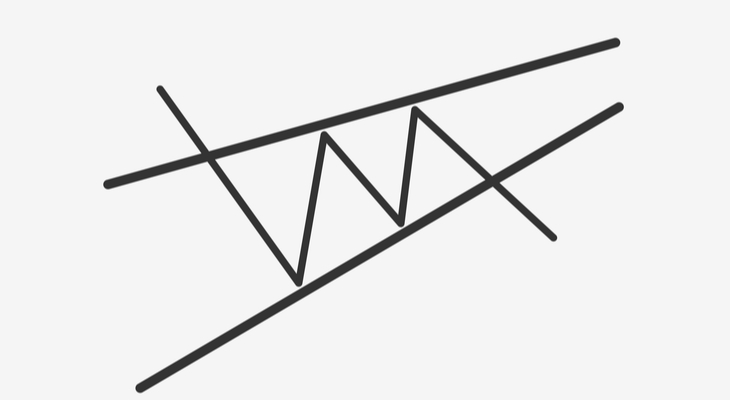
For the rising wedge to be a useful trading signal, it ought to be seen to funnel the price into narrow range but it does not necessarily have to be a point.
As the wedge forms, the price ought to be making higher lows and higher highs in a saw tooth pattern.
Here’s how you can confirm reversal and continuation patterns formed rising wedges:
Reversal Pattern
- Established uptrend
- Rising wedge consolidation formation
Linking higher highs and lower lows using a trend line assembling towards a narrowing point
- Confirm divergence between price and volume using volume function. You can also confirm using the Moving Average Convergence Divergence (MACD).
- Overbought signal can be confirmed by other technical tools such as oscillators
- Look for break below support for short entry
Continuation Pattern
- Established downtrend
- Rising wedge consolidation formation
- Linking lower lows and higher highs using a trend line assembling towards a narrowing point
- Confirm divergence between volume and price using volume function. You can also confirm using the Moving Average Convergence Divergence (MACD).
- Overbought signals can also be confirmed by other technical tools such as oscillators
- Look for break below support for short entry
Trading the Rising Wedge
Ascending wedges can be one of the most challenging chart patterns to trade and recognize.
Like most patterns, it is important to wait for a stock breakout and make use of other technical analysis tools to confirm signals.
In the following section, we will discuss a bit more about how to use these chart patterns to your advantage.
Bearish Reversal Signal
The important thing to do after spotting this stock trading chart pattern is to be ready with your entry orders. In the example below, a rising wedge formed at the end of an uptrend.
You can see how price action is forming new highs, but at a much slower pace than when price makes higher lows.

Later, the price breaks down to the downside since there are more traders desperate to short than long. This pushes the price down to break the trend line, suggesting that a downtrend is likely to occur.
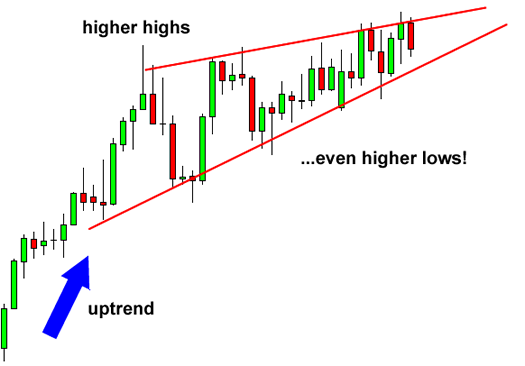
Bearish Continuation Signal
In this next example, the price came from a downtrend before consolidating and forming higher highs and even higher lows. It later broke to the down side and the downtrend continued.


Rising Wedge Pattern Confirmation
A rising wedge is considered valid if it has good oscillation between the two bullish lines. To validate this pattern, each of these lines must have been touched at least twice.
It must also be remembered that a line is said to be valid if the price line touches the resistance or support at least 3 times.
Simply put, the rising wedge pattern is said to be valid if the price touches the support line at least twice and the resistance line 3 times (or touches the support line at least 3 times and the resistance line twice).
Rising wedge patterns are quite useful in predicting general price trends. This pattern will breakout towards a reversal more often than two-thirds of the time.
Since the pattern converges to a smaller price channel, the distance between the price on entry of the trade and the price for a stop loss, is relatively smaller than the start of the pattern.
This means that you can place a stop loss close by at the time the trade begins.
Additionally, if the trade is successful, the outcome is likely to yield a greater return than the amount risked on the trade to begin with.
Bottom Line
Rising wedge patterns are quite common among day traders and they can be useful at any timeframe.
The formation of these patterns on price charts has been considered an important sign that a reversal will eventually happen.
But unlike some other patterns that are easier to read, rising wedges may show some ambiguous behavior that make them tricky to interpret.
Therefore, traders looking to use rising wedge patterns in order to forecast upcoming price movements ought to carefully consider the length and the context of the formations in which they occur; and use volume changes and complementary technical indicators to verify the movements that they appear to be signaling.
Most importantly, they need to use a stop loss to guard against the effects of false signals and be ready to adjust their strategies quickly for changing conditions should these occur.