

Accurately predicting market bottoms and tops is not an easy task even to the most experienced traders and investors. Most of the time, whether a market moves up or down is near 50/50.
Even though some conditions can tilt those odds meaningfully in either direction, it’s hardly enough to prognosticate.
Instead, the way of thinking should be, how can I spot potential inflection points in markets? Inflection points which are more likely than any random piece of market data to precede increases in volatility or momentum.
I liken this to card counting in blackjack.
In Hollywood, its portrayed as a get-rich-quick scheme used by eccentric geniuses. In reality, card counting is very much like trading.
Most of the time, you’re making small bets with a slight positive expectancy until the deck is tilted significantly in your favor, which is where you start betting big.
That’s exactly what most discretionary traders do.
We make small trades on everyday setups, until a triple-A setup arises and we significantly increase our risk.
Most of the time, these triple-A setups occur near inflection points or market bottoms and tops.
Identifying Market Tops and Bottoms
Break of Trend
Of course, not all market tops and bottoms occur within trends. But, I’d argue it’s even more difficult to find consistently profitable opportunities in non-trending, range-bound markets.
The price mostly bounces around randomly, giving us little to no structure to contextualize the current market action.
If we’re to assume that we’re only seeking inflection points within trending points, looking for a break of the prevailing trend is the first place to start.
Each trader has their own definition of a trend. Some use indicators, trendlines, growth rates, etc., the base way of classifying trend vs. non-trend is a series of higher highs and higher lows (vice versa for downtrends).
This is the basic pattern. Anything beyond this is down to preference.

What constitutes a “higher high” in this framework are pivot points or swing highs/lows; different terms for (usually) the same thing.
Below is a clean example of a trend break. The security makes two consecutive trend “legs” (both a higher high and higher low), followed by another higher high and a lower low. The trend has broken.

Of course, that lower low cannot be the market top because it’s a low.
However, it’s telling you that the market has weakened and can no longer sustain the trend pattern. This could help you identify significant inflection points.
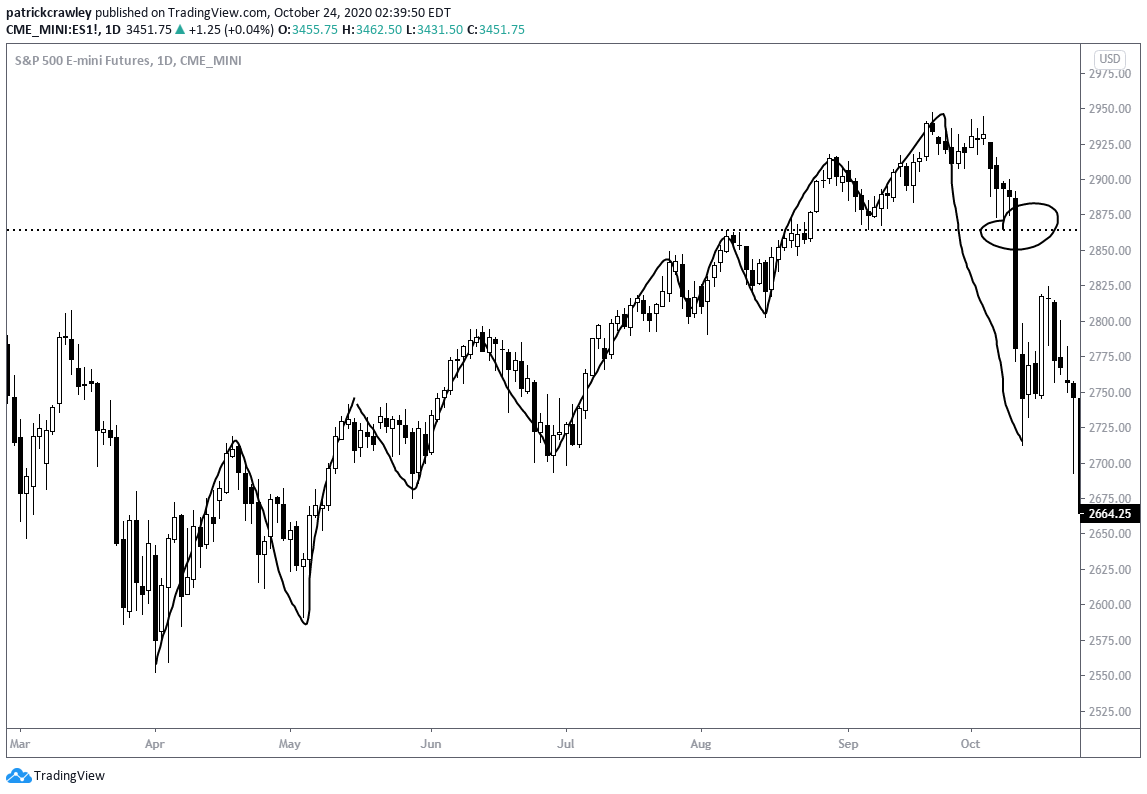
Here’s a real-life example in the S&P 500 futures. Excuse the crudely drawn swings.
The TradingView pen likes to snap to price action. Most examples won’t look like this (massive downside momentum once the trend pattern breaks), but this illustrates the cascading effect that could occur when a strong trend breaks.
Creating a framework for analyzing each swing or ‘leg’ of a trend allows you to place a security’s current position within its trend into context.
Should you be getting more or less aggressive, and should you be joining the trend or beginning to look for counter-trend trades?
It’s essential to place a security’s current position within its current trend into context. Crucial questions to ask are:
- How many swings have occurred within this trend?
- Are recent upswings stronger or weaker in magnitude than those earlier in the trend? Another way to put this is: is momentum advancing or declining at this point in the trend?
- Have ranges considerably expanded or contracted at this point in the trend?
By swing, I mean each ‘leg’ of a trend move, divided up by swing highs and lows.

Trend Climax
A trend climax is the last swing of a trend, typically characterized by many extremes in volatility, volume, and sentiment.
A climax will typically occur after a trend has already exhausted itself and has had several back and forth swings.
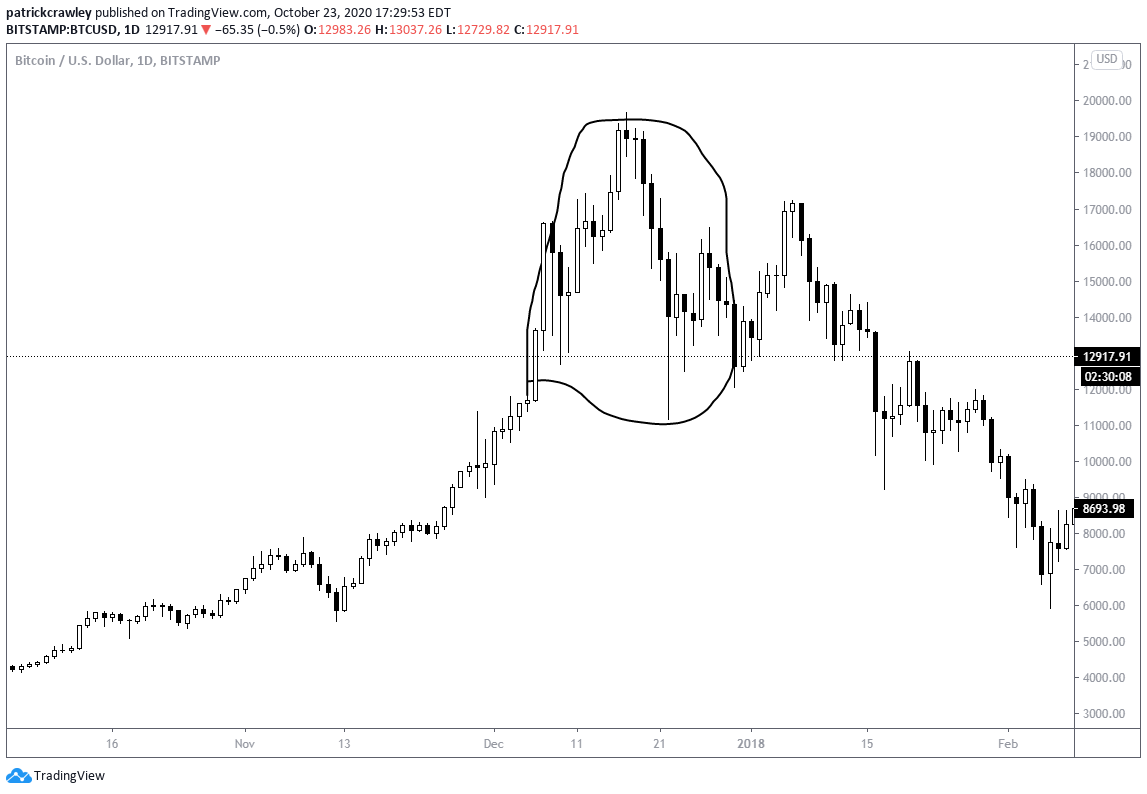
The most obvious and relatable example is the 2017 bull run in Bitcoin. Notice how the ranges significantly expand in the late stages of the trend, followed by a vicious pullback, ending the trend.
Price not only broke the previous lower high, but it failed to make a new higher high in the subsequent upswing.
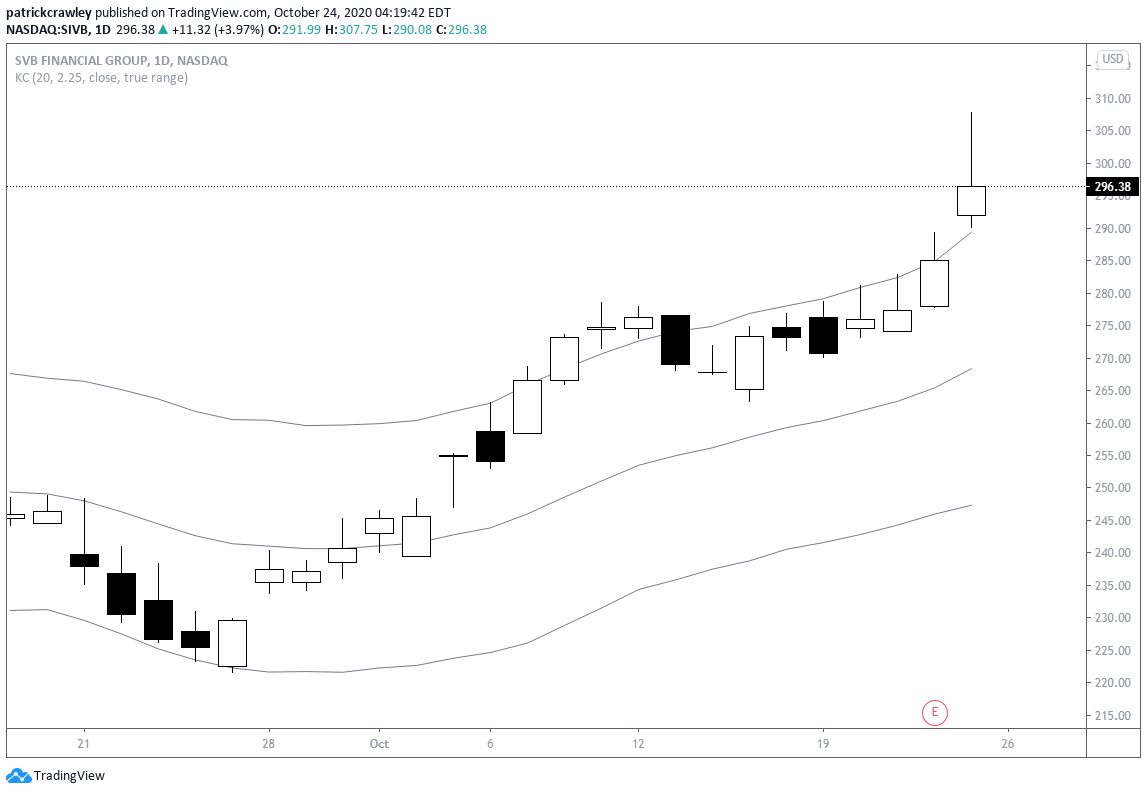
Here’s an example where we don’t yet know the outcome.

What’s going on here?
- The stock has been in a steady and robust uptrend for over a month with no pullbacks.
- The stock recently went parabolic.
What are we to think here?
First off, given that the stock has yet to see anything resembling a pullback, strength is likely to continue until the stock can reach at least some recent levels.
Further, the two high-range candles are Bullish Marubozu candles, meaning they have no high/low wicks–indicating that the market went high to low, with no significant pullbacks.
This is a sign of immense strength.
Here’s a situation where there’s a bearish catalyst. The stock is extremely strong as of now.
Another example of which we don’t yet know the future.
What’s going on here?
- The stock is in a short-lasted uptrend and recently broke out above a resistance level.
- The breakout candle is a “shooting star” candle, also known as an “inverted hammer,” indicating that the stock reached a significant high intraday and was strongly rejected.
Combining the fact that most breakouts fail and the post-breakout weakness, there is potential for a failed breakout trade here.
Caution would be rewarded here, though, as this is a burgeoning trend without a significant pullback yet. The price target for such a trade would be the resistance level, as considerable downside follow-through is unlikely to unfold.
Bottom Line
To most traders, the idea of picking tops and bottoms is best left to pundits on CNBC–that is, it doesn’t pay.
However, this article wasn’t about that type of useless prognostication.
This article is less about trying to buy the bottom and sell the top and more about identifying market conditions where market dynamics may begin to shift and create very favorable trade setups.
Again, those conditions very often occur near price extremes, or tops and bottoms.