

Supply and demand are the underlying forces behind every chart breakout, every failed parabolic move, and each bounce off support and resistance.
It’s easy for us to get wrapped in the minutia of the trading world; indicators, backtesting platforms, metrics, etc.
But, while these trading tools are undoubtedly useful, they can sometimes serve to abstract us from the reality that stock prices change solely due to a change in supply or demand.
When a stock price increases, buyers want the stock more than the sellers want to sell it. As a result, the price must increase to meet the demand.
This is a simple truth.
The Stock Market is an Auction
The stock market is a continuous two-way auction. Buyers and sellers give their best price and are automatically matched when those two prices converge.
With sellers serving as the supply-side, and buyers the demand-side, supply and demand play out in real-time.
Liken this to an eBay auction. A seller can set an “ask” price, as you do in the stock market, which is the “Buy It Now” button, and they can also allow buyers to bid on the item.
If the asking price is too high, buyers may attempt to bid on the item to get a more favorable price. However, buyers who really want the item are less price-sensitive and will just pay the ask.
This immediately eliminates a potential choice to other buyers, supply down.
In the stock market, you have similar events.
Participants set their bids and asks and wait for someone to trade with them. As one side of the auction gets more eager to buy or sell, prices will have to increase or decrease to keep the supply intact.
As a thought experiment, imagine the stock price of Apple was price-fixed at $100/share.
If the market decided that Apple was worth $200/share, all of the supply would quickly be purchased, leaving no supply left because the deal is so favorable.
Here’s a quote from economist Milton Friedman about simple supply and demand in the stock market:
Of course, it doesn’t matter who is selling. If you’re selling, somebody has to buy. In order to get somebody to buy, you’ve got to encourage them, the price has to go down.
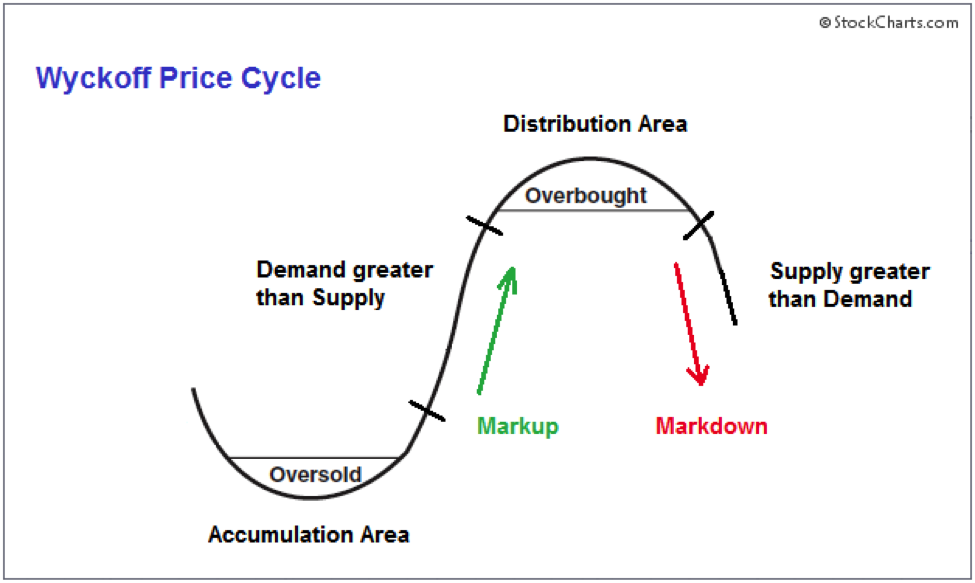
Accumulation and Distribution
One of the prominent traders of the 20th century, Richard Wyckoff, had a stock market framework centered around observing subtle changes in supply and demand.
Wyckoff painted the idea of a “Composite Man,” also known as “smart money.” These operators essentially control the stock market through their strategic buying and selling.
His strategy was to join the same side of the market as the smart money and spot the breadcrumbs when they abandon a market.
Wyckoff aimed to join trends before they begin, in the “accumulation” area.
This is the area of low market activity and range-bound trading, but Wyckoff studied the subtleties of these trading zones, and found that they sometimes contain the smart money ‘secretly buying [or selling]’
The primary method to spot smart money building or offloading positions in accumulation and distribution areas is Springs and Upthrusts.
These are characterized by the market testing a break of support or resistance and sharply rejecting the test on high volume and intraday momentum.
Here’s a graph showing both springs and upthrusts

How Supply and Demand Get Constrained
Theoretically, any limits on market participant’s ability to freely trade in and out of the stock market constrain true and supply and demand.
Examples are government regulations, IPO lockups, employee stock provisions, etc.
Regulations
Economist Milton Friedman theorized that government regulations against insider trading play a role in the formation and protection of fraudulent companies like Enron and Worldcom.
He told CNBC in 2003 that if insiders at Enron were able to sell their shares with the knowledge of the company’s inside operations, Enron’s fall would have had far less drastic effects on investors and financial markets in general.
Here’s Friedman on the potentially harmful externalities of financial market regulation:
Friedman: Here you’ve got a company like Enron which is doing fraudulent things. People on the inside know about it. One of the best ways to bring it out is to make it profitable, to make that knowledge profitable to them. A whistleblower takes a chance, doesn’t gain anything by it. But a person on the inside who knows things are going wrong, who just engages in selling in Enron stock, can make money on it and at the same time serve the market purpose of driving down the price of the stock. And that alerts other people,
Of course, the counterpoint to this argument would be that legalized insider trading would create its own set of externalities to deal with.
Among them would be an underlying unfairness between market participants and potentially harmful incentives for company insiders.
IPO Lockups
Any restriction on the trading of shares will have effects on the supply and demand of those shares.
Because a portion of the shares is unable to trade, there’s an artificial supply constraint that may have significant effects when it is removed.
Investors who buy into an IPO before the stock goes public typically deal with strict rules around trading their shares.
This is most often in the form of a share lockup to incentivize investors to have a longer-term approach and not dump their shares on the first day of trading, which would make the IPO a failure.
Several academic studies study the price changes of stocks after their IPO lockup, and most find abnormally negative returns in the days following the lockup expiration.
One study, called Market Reaction to the Expiration of IPO Lockup Provisions, found cumulative average abnormal returns (CAR) to be -1.45% ten days after the lockup period.
That basically means that the IPOs this study covered went down an average of 1.45% ten days after lockup expiration.
A recent example of a stock reacting poorly to its lockup expiration is Tilray (NASDAQ:TLRY).
Being one of the first cannabis stocks to hit US exchanges, there was also a supply constraint on cannabis-related equities in general, and Tilray went parabolic.
Below is a chart of the first month of Tilray trading prior to the lockup expiration.

At one point, the stock traded at a price-to-sales ratio of over 600. For reference, Apple currently sells at a P/S of about 7.
The company’s IPO lockup period was January 15th, 2019, here’s the dramatic market reaction to the increased supply of shares:

Bottom Line
By understanding the vital relationship between supply and demand with asset prices, you can find market inefficiencies to take advantage of this.
We laid out the IPO lockup example, which is supported by academic evidence.
Uncovering the less scalable and hidden opportunities simply takes curiosity and keeping these ideas in the back of your mind.
Some other examples of inefficiencies might be companies doing equity raises, daily trading imbalances, and index rebalancing.
In summary:
- The stock market operates as a two-way auction, where buyers and sellers compete by naming their best prices. When those two converge, a trade is made. Cumulatively, these trades are responsible for stock price changes.
- The stock market isn’t perfectly efficient. There are several constraints on supply and demand, some of which can be taken advantage of.