

2021 was a complete break from the norm of the last decade. We’re experiencing the first serious bout of inflation since the 1970s, a rally in commodities that some are calling a new “supercycle,” and some of the craziest short squeezes in history.
Many of 2021’s most compelling stories will surely have some place in the financial history books, and the pandemic is a catalyst for most of them.
I’ve collected a mass of charts throughout this year from a barrage of sources, with the biggest source being The Daily Shot’s daily newsletter which is packed with charts, as well as financial Twitter, news articles, blogs, and the like.
The 2021 Mega Theme: Inflation
It comes as no surprise that after printing trillions of dollars and shutting down portions of the US economy that we’re experiencing inflation.
The Federal Reserve, for better or worse, responded to coronavirus with “unlimited” quantitative easing to stimulate a shutdown economy following the coronavirus panic.
The combination of heaps of economic stimulus (much of it driven directly to consumers, like PPP and stimulus checks), pent-up demand from lockdowns easing, and supply chain constraints driven by labor shortages and sudden demand are the perfect storm for inflation.
Nassim Taleb put it this way: buying 50 things in 2020 and 50 things in 2021 are not the same as buying 0 things in 2020 and 100 things in 2021.
One of the primary post-pandemic investing battlegrounds is between the “hyperinflationistas,” who believe destruction of the US dollar is imminent, and that we’re due for massive inflation, and the “transitory” crowd, who think that inflation will be short-lived merely as a result of short-term supply chain constraints that will sort themselves out.
These charts tell the story of that battle. Let’s hope that whoever ends up being right in the end has the P&L to match that, or else what’s the point right?
M2: How Much Money Is There?
At its most basic, inflation occurs when there is more money chasing fewer goods. You can get that from increasing the money supply, or deflating the goods supply.
One way we can measure how much money is in the economy is the Federal Reserve’s M2 money supply.
This essentially counts up all of the money in cash, checking accounts, savings accounts, money market accounts, and time deposits like CDs.
Below is a chart of M2 from the late 1950s to 2021:
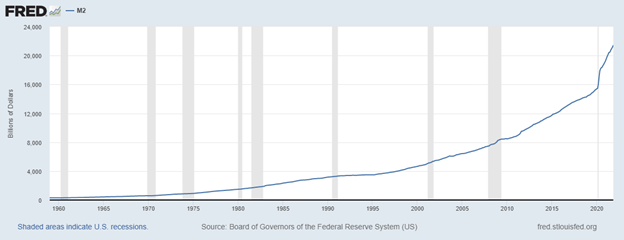
Higher M2 means more money is floating out there in the economy. This number is almost always going up, and that’s by design. As you can see, the money supply has been steadily growing over the last several decades. And this makes sense. Both GDP and population have been growing, and arguably, a good currency (which is transactional and not an investment or store of value) steadily loses value over time to encourage actual investment and not the hoarding of cash.
But the rate of change massively accelerated in 2020 and 2021. The chart almost looks like a stock which had a huge surprise earnings beat. The upshot here is that there’s a ton more money in circulation than there was before.
CPI: The Official Inflation Rate
CPI gets a lot of flak for questionable weightings and whatnot, but it’s the official inflation benchmark used by the US government and tons of inflation-pegged securities, so even if it’s not the best gauge of inflation, it’s still pretty important.
CPI hit an annualized rate of 7% in December 2021, the highest since the 1970s. It’s inarguable that inflation is back, the argument now is whether it’s temporary or here to stay. Fed Chair Jerome Powell, who popularized calling inflation “transitory” stepped back from that tone back in December, though, after repeated ugly CPI prints. For now, Team Inflation is in the driver’s seat.
Below is a chart of CPI since the BLS started tracking the data in the 1940s:

Let’s take a more granular look at the components driving the inflation:

Lumber
Lumber prices went way up in 2021, way down, then way up again. This volatility was driven by the boom in housing development and renovation post-pandemic, which account for roughly 70% of lumber demand.
All of this new development is driven by migration out of cities and into the suburbs and rural areas.
Just look at this rally compared to the previous 10 years of price action:

Estimates puts $36,000 as the average added cost to a new home as a result of lumber prices at those elevated levels.
The Devaluation of the Turkish Lira
Turkey, like many nations right now, has an inflation problem. But Turkey’s is potentially regime-breaking, while the US and Europe’s are merely headache-making.
Turkish President Erdogan ordered the printing of tons of money while simultaneously cutting interest rates: this makes money plentiful and hence, worth less.
Let’s take a look at the US Dollar to Turkish Lira exchange rate:
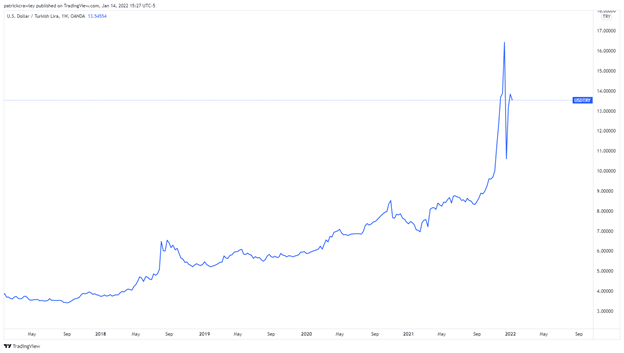
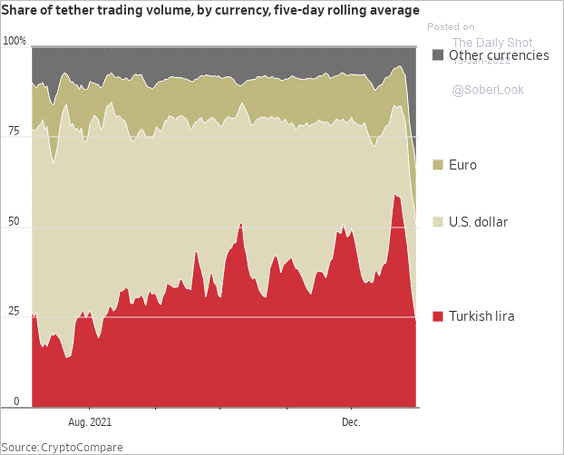
Turkish citizens responded by exchanging their Lira for crypto in yet another instance of victims of inflation turning to crypto. Tether trading volume was more than 50% in Turkish Lira briefly in December:
Returns of Equity Strategies
One of the main equity themes of early 2021 was the ‘reflation’ trade, in other words, selling long-duration assets like unprofitable tech, and buying companies with strong cash flows that are resistant to inflation.
A good proxy for this is simply growth vs. value. Let’s see how the primary equity factors performed in 2021:

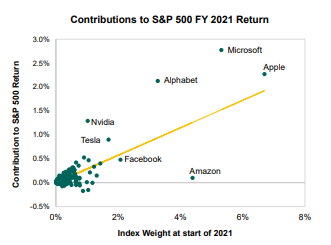
It’s a pretty mixed bag, mostly owed to the different quantitative definitions for different factor indexes created by S&P Global. And much of this could be distorted by the fact that S&P 500 returns were driven primarily by the FAANG universe of stocks:
It’s also worth noting the returns of cyclical assets relative to defensive assets:

Source: topdowncharts.com
The Year of Retail
The retail trader played a huge role in the 2021 equity markets, accounting for 23% of all US equity trading, compared to just half that in 2019.
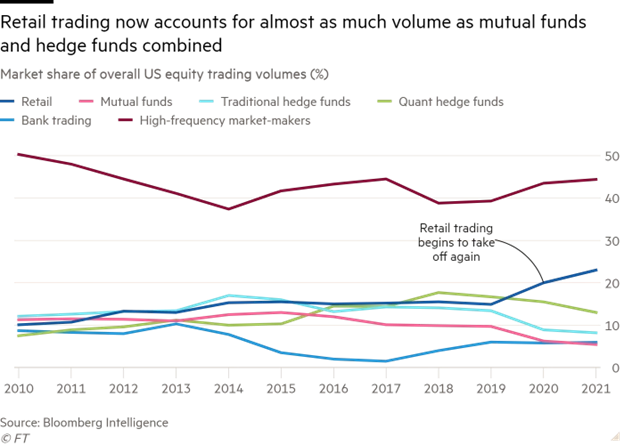
Source: FT
Their increased interest in trading makes market makers more interested in trading, because retail trades are ‘uninformed order flow,’ which is profitable to trade against. So the more retail trades, the more MMs want to trade. This leads us to the following graph:

We can’t talk about retail without talking about some of their favorite stocks: GameStop and AMC. These were historic short squeezes achieved by retail traders collaborating on Reddit, Twitter, and the like to buy the same highly-shorted, relatively illiquid names in size.
After the pandemic, the writing was pretty much on the wall for GameStop and AMC. The former relies on people buying physical video games from the mall when most of that business is digital, and the latter is a movie theater chain in an era of at-home streaming during a pandemic. Both had pretty ugly financials and are classic ‘melting ice-cube’ shorts.
So hedge funds shorted them in size. Shorting stocks like these provides a downside hedge, this allows hedge funds to buy their favorite stocks on margin because of the protection their shorts provides. The theory goes that if they’re good at picking both good and bad companies, their good companies will go up more than the bad ones, and they’ll make a nice return without taking massive risk.
But Redditors figured out GameStop and AMC were “hedge fund hotels,” stocks which hedge funds crowd into, making it a game of hot potato. And this gets more violent on the short side, as was on display with the Volkswagen short squeeze during the financial crisis.
While these trades were discussed all throughout the internet, Reddit’s WallStreetBets was definitely the central hub.
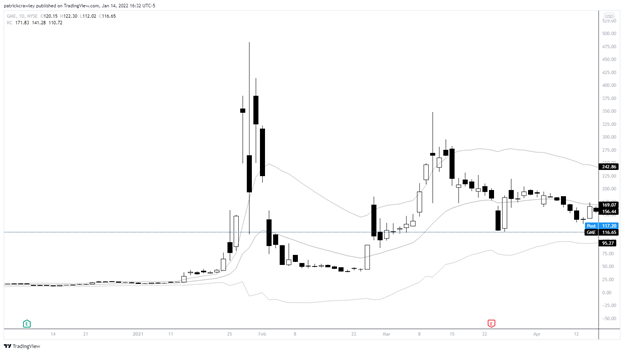
Here’s a chart of GameStop (GME), the first of the mega short squeezes:
AMC squeezed alongside GME in January 2021, but it wasn’t the main event until summer 2021:

Perhaps most impressive is the staying power of these stocks. While most short squeezes are fleeting; they last a few days before returning to the pre-squeeze price, GME and AMC were different.
The traders in these stocks actually believed in these companies and many remain as long-term investors. Partly due to their belief in the company, partly because they believe more short squeezes are imminent, and partly as a form of protest against hedge funds that they believe are market manipulators.
While both AMC and GME have cooled off considerably since their squeezes, their prices have remained steady above their post-squeeze levels for several months each, a testament to the unpredictability of retail investors:

Beyond just trading short squeezes, retail traders became enamored with options trading in 2020 and 2021, driving record volumes in the options market.
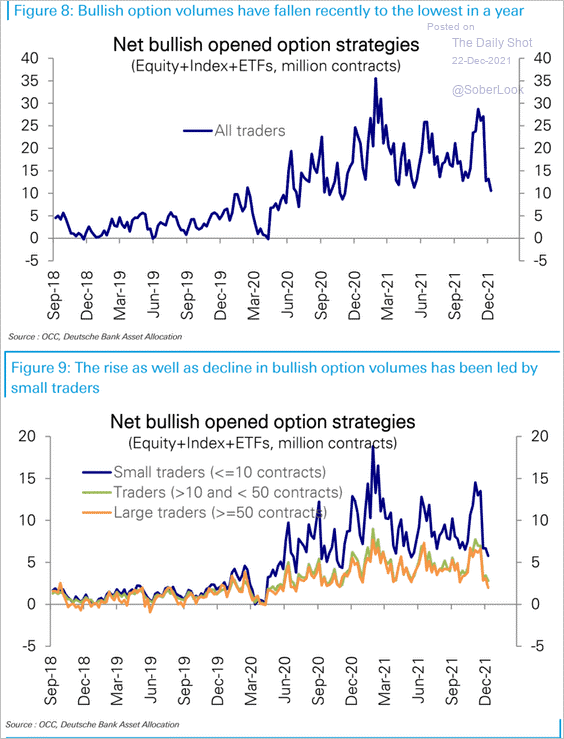
Much of this increased retail trading activity is attributed to the pandemic. People were stuck at home and found Robinhood and WallStreetBets. As evidence, Robinhood almost doubled their users in 2021 alone. Bloomberg’s Matt Levine calls this phenomenon the “boredom markets hypothesis.”

Source: BusinessOfApps
Bill Hwang’s Big Bet Goes Wrong
Before his blow-up, Bill Hwang was a pretty legendary investor. He was a Tiger Cub, meaning he opened up his own Tiger fund under the guidance of Julian Robertson. He opened Tiger Asia Management which eventually grew to over $5 billion at its peak.
He minted a fortune from managing the Tiger fund and opened a family office, which managed his own and close associates’ $10 billion of money.
In dealings with several different investment banks, Hwang bought total return swaps on a concentrated portfolio of media and Chinese tech stocks with considerable leverage. He controlled so much of the float of these stocks that there was nobody to sell to should things go wrong.
Well, one of his stocks, ViacomCBS, announced a secondary offering which must’ve given him a margin call as his brokers began aggressively selling shares to recoup their principal. But because he was so leveraged and the selling was so aggressive, the prime brokers ended up eating large losses. Credit Suisse lost an estimated $5.5 billion in the debacle.
Here’s a Bloomberg chart of a few of his key portfolio holdings:

Source: Bloomberg
However, you don’t see the real damage unless you look at individual charts.
ViacomCBS (VIAC):

Discovery (DISCA):

Many of these stocks have yet to recover their massive one-day losses. But that could simply be due to the fact that Hwang’s buying was pushing the price up to unsustainable levels, and once he exited the market they reverted to fair prices:

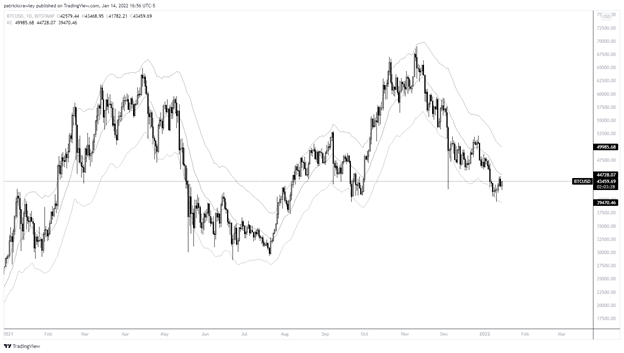
Crypto vs Metals
Precious metals like gold and silver are seen as long-term stores of value and a hedge against US dollar inflation. But the growth of crypto is threatening its status as an inflation hedge.
In the year with the highest inflation on record in decades, Bitcoin handily outperformed precious metals, which actually went down in value:
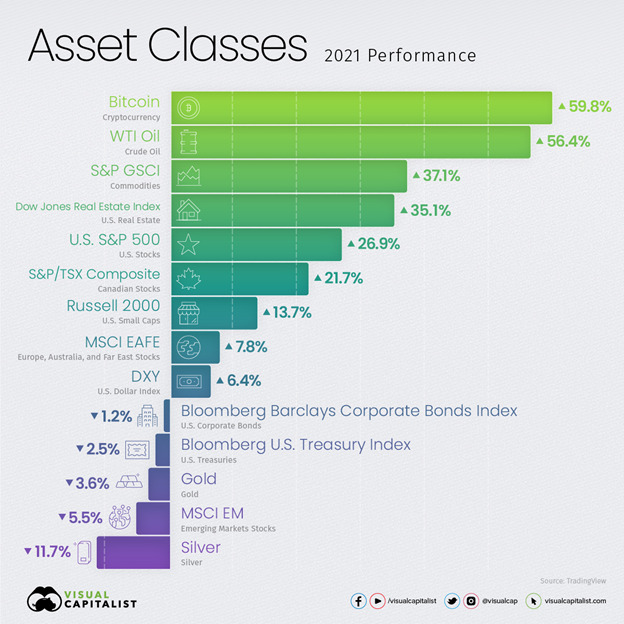
Source: Visual Capitalist
Many gold investors are disappointed, as this really seems like gold’s time to shine and it’s asleep at the wheel, moving sideways for all of 2021:

However, Bitcoin is not without its own issues. Rather than lack of action, like gold, the entire crypto market has been predictably volatile in 2021. If the start and end dates were a bit different, gold may have outperformed:
Bottom Line
2021 was such an exciting year in the financial markets. This article could easily be two or three times as long as it is, there were so many compelling stories. Among some of those I’ve left out:
- The US dollar’s relative strength against global currencies
- The interesting developments between labor and capital, between work-from-home and labor shortages.
- The parabolic moves in the used car market
- How energy became centrally important to Europe in 2021
- Supply chain bottlenecks, and the projections of industry insiders