
- When a Dead Chart Suddenly Comes Alive
- What Exactly Is a Reverse Stock Split?
- Why Companies Use Reverse Splits
- Why These Stocks Suddenly Move Fast
- The Cycle I See Again and Again
- The Reality of Offerings and Dilution
- How I Approach Trading Reverse Split Names
- What I Look For
- How I Manage Exposure
- The Psychological Side
- Final Thoughts: What a Reverse Stock Split Really Means for Traders
Watch Full Video Here: Reverse Splits & Secondary Offerings
When a Dead Chart Suddenly Comes Alive
Every now and then, I’ll pull up a chart that’s been grinding lower for months, only to see one massive green candle that makes no sense at first glance. Usually, that move traces back to one thing: a reverse stock split.
These aren’t strong companies with healthy trends. Most of the time, they’re small caps that slipped under a dollar, lost investor trust, and finally got “repackaged” through a reverse split.
Despite the ugly history, they can become some of the most explosive day trading opportunities because the float suddenly gets tight and volatility spikes.
What Exactly Is a Reverse Stock Split?
A reverse stock split is just a share consolidation. The company reduces the number of shares and increases the price proportionally.
If I’m holding 10,000 shares at 50 cents and the stock does a 10-for-1 reverse split, the next day I’ll have 1,000 shares at $5. The value barely changes. In a reverse split, it’s the opposite — the price goes up and the number of shares goes down.
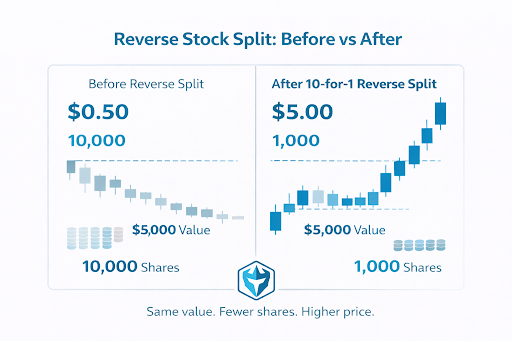
I often explain it as “trading a hundred-dollar bill for five twenties.” Nothing magical happens to the fundamentals. It’s cosmetic, but it solves a problem for companies that have been sliding under $1 for too long: minimum bid price requirements.
Why Companies Use Reverse Splits
The pattern is predictable:
- The company IPOs, burns cash, and never becomes profitable.
- The stock drifts lower until it’s delisting-level cheap.
- Instead of fixing the business, the company does a reverse split to boost the price back above $1 or $5.
The fundamentals usually stay the same, but the optics improve overnight.
Why These Stocks Suddenly Move Fast
A reverse split can chop the float dramatically. Ten million shares outstanding might become one million. Once that float shrinks, supply drops and demand has more leverage. A little buying pressure can push the stock into a huge squeeze.
That’s how these names go from looking dead to running 100%, 200%, even 300% off the lows. It went up almost 300% following that split. The chart that’s been red for a year suddenly prints the biggest green candle it has ever had.
The move isn’t because the company turned itself around. It’s because the float was basically reset.
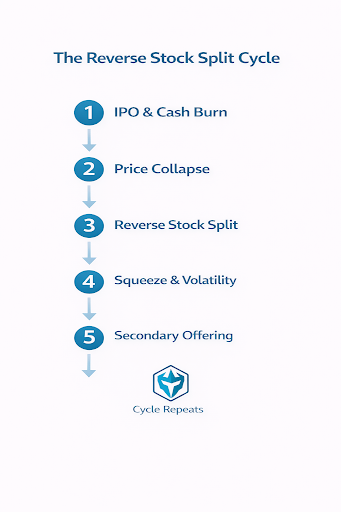
The Cycle I See Again and Again
Over time, I’ve noticed a pattern in a lot of these small caps:
- IPO and cash burn
- The company raises money at $10+ per share.
- They burn the cash over a few years without becoming profitable.
- Price collapse
- The stock slowly bleeds down toward $1 and sometimes under it.
- Reverse stock split
- They do something like a 10-to-1 reverse stock split.
- The float shrinks (for example, from 10 million shares to 1 million shares).
- The price pops back up to, say, $10.
- Good news and squeeze
- The company puts out positive news.
- Traders see a low-float stock coming off the lows, and the stock squeezes 100%, 200%, sometimes 300% or more.
- Secondary offering
- Into that liquidity, the company taps a shelf registration and sells more shares.
- Existing shareholders get diluted heavily.
I’ve seen this movie so many times that when I see a fresh reverse stock split, I immediately start thinking about float, possible catalysts, and the risk of an offering. It’s very common to see this cycle: reverse split, some good news, and then a secondary offering.
The Reality of Offerings and Dilution
Once a reverse split happens, I always check filings. If there’s an S-3 or F-3 shelf registration, that means the company can raise money at any moment.
I’ve watched these stocks spike into a clean breakout, only for an offering to drop minutes later. The result can be violent:
- Sharp, liquidity-draining dumps
- Gap downs bigger than most traders can mentally prepare for
- Instant trend reversals
If there’s one thing that defines reverse split stocks, it’s how quickly they can turn against you. The volatility works both ways.
How I Approach Trading Reverse Split Names
A reverse stock split is context, not a signal. I don’t buy a stock just because it had a split. I treat the split as a clue that the float might be unusually low and the stock might move aggressively. But I still want clear setups.
What I Look For
- Strong premarket volume
- Clean intraday trends
- ABCD setups
- High-volume breakouts with room on the daily chart
- Tight spreads (or at least predictable slippage)
These names aren’t for casual trading. The volatility can be extreme, and the spread can widen without warning.
How I Manage Exposure
- I reduce position size on these trades.
- I avoid holding them longer than necessary.
- I shave profits into strength.
- I don’t hold them overnight.
The risk isn’t just price action. It’s the constant threat of dilution.
When a company has a history of reverse splits and offerings, I assume that behavior will continue.
The Psychological Side
Trading these names can feel like a trap. You’ll see a stock getting walked up with big bids, only for an offering to nuke it. I’ve been in trades where I barely avoided getting hit by dilution that would have blown up the entire setup.
It’s easy to assume someone behind the curtain is manufacturing the squeeze to create liquidity. Whether that’s true or not, the behavior is predictable enough that I treat these stocks as temporary trading vehicles, not investments.
The key is keeping my expectations realistic. These aren’t “great companies.” They’re opportunities born from low float mechanics.
Final Thoughts: What a Reverse Stock Split Really Means for Traders
A reverse stock split doesn’t fix a broken company. It doesn’t magically turn a weak business into a strong one.
It’s a mechanical move that:
- Raises the share price
- Shrinks the float
- Keeps the listing alive a little longer
For traders, that combination can create some of the biggest intraday moves in the market, along with some of the nastiest wipeouts. If you choose to trade these setups, treat them with respect.
Understand the pattern, check the filings, be aware of the risk of offerings, and manage your downside first. You can’t control how high a stock will go, but you can control how much you’re willing to lose.
Trading is risky. My results are not typical. Most traders lose money. Practice in a day trading simulator, learn the patterns, and don’t blindly follow anyone. Manage your trading risk, and let everything else come after that.