

Japanese candlestick chart patterns are a way to read and interpret the price of financial instruments.
Over the last few decades, traders have been using them to make trading decisions and predict the short-term direction of the price of market instruments.
Candlesticks are believed to have been invented in the 1700s by Japanese rice trader called Munehisa Homma, but it is highly likely that they developed a lot after their initial use.
These charts are highly popular among because they are quite easy to read and are an effective way to interpret price and study the emotions of other traders.
With candlestick charts, you can see the opening and closing prices of a stock, as well as the highest and lowest points the stock reached.
In this post, we are going to go over a rare candlestick pattern known as bearish abandoned baby pattern. We will get to know what it looks like, why it forms, and tips on how you can trade the pattern.
What is the Bearish Abandoned Baby Pattern?
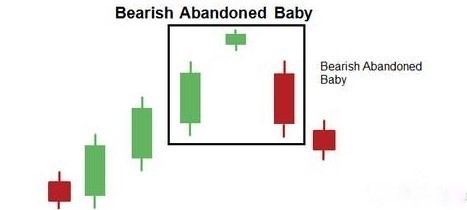
The bearish abandoned baby is a reversal pattern that forms during an uptrend. It is characterized by three candles, where the first candle is long bodied and white/green.
The second candle is a Doji that gaps above the close of the first bar in the series. The third candle opens below the close of the second bar and is long bodied and black/red.
This pattern is used by traders to exit a buy position and enter a short position.
The reason why it is considered rare is because its sequence denotes a market that very neatly cycles through unabashed bullishness, perfect indecision, and dire bearishness – all with no overlap of trading range in between sentiment and the resulting auctioning between traders remains cleanly compartmentalized.
The bearish abandoned baby pattern has an opposite known as bullish abandoned baby pattern.
What the Bearish Abandoned Baby Pattern Looks Like
As mentioned earlier, the bearish abandoned baby pattern consists of a large and hallow candle (signals that the stock closed near the highs of the day) that is followed by a Doji whose body and shadows stand alone.
These two candles precede a large down candle that closes within the body of the first candle as shown in the figure below.

Here is what you should look for to identify a bearish abandoned baby pattern:
- There must be a large white (or green) candlestick in an uptrend.
- The white candle must be followed by a Doji that gaps above the close of the first candle.
- The last candle in the three-candlestick pattern must be black (or red) and open below the Doji.
Remember that it is very important that there are gaps between the first and second candles as well as the second and third candles.
Why It Forms
Bearish abandoned baby pattern signals a reversal in a bullish period.
It underlines weakening buyers and is a warning sign for traders longing their stock positions. The pattern forms when the market sentiment shifts from buying to the selling of a stock.
In other words, it forms because buyers are becoming less aggressive at the higher prices allowing sellers to take over. The reasons behind this can be fundamental or psychological.
Example of a Bearish Abandoned Baby Pattern
As the name suggests and the pattern intimates, the bearish abandoned baby pattern anticipates lower prices. Here is an example of a bearish abandoned baby pattern:
The green candlestick is a large bullish candle and forms when the price of a stock or other security closes higher than previous candles. Traders take their profit on this candlestick and exit their position.
The second candlestick in the bearish abandoned baby pattern is a Doji candle and forms when a stock open and closes at almost the same price.
This candlestick signifies indecisive action by traders and is usually represented by a dash or a star type visual. Buyers and sells are in a close fight at this point.
The red candlestick is the last formation and completes the bearish abandoned baby pattern.
The buyers lose momentum and price drops with a large bearish candle. Traders usually cut their losses at this point and await the next market reversal.
Tips for Trading the Pattern
Just like the bullish abandoned baby pattern, the bearish abandoned baby pattern is not something traders see every time when they open a chart. This pattern is more of a rare formation that you may not come across often.
However, when the pattern is formed, it is both profitable and reliable for identifying a major trend reversal.
If this pattern is accompanied by low volume, it means, the sellers topped the buyers because the buyers left and yielded to the sellers.
We have decrease in bullish pressure, but we do not yet have increase in bearish pressure. While this pattern continue signaling a bearish reversal, the reversal down could be short lived – we do not have strong sellers.
On the other hand, when the pattern is witnessed on a strong volume surge, it is a sign that the sellers became dominant because a new wave of the sellers began to sell in large volumes.
These new and stronger sellers completely suppressed the buyers.
In this case, we have strong increase in the bearish pressure and we may expect a stronger reversal down. We have strong sellers who may continue beating the buyers.
It is important to remember that the first and last candlestick ought to be significantly large to complete the pattern.
The bearish abandoned baby candlestick pattern usually remains invalid if the third candlestick does not send the price lower than the half body of the first candle.
Bottom Line
The bearish abandoned baby is a popular Japanese candlestick patterns, and is used by many day traders in their market analysis.
It is also one of the best visual patterns that you can use to confirm a market reversal.
If you are just starting with stock trading, the bearish abandoned baby pattern will probably help you make quick gains by leveraging on short positions.
However, it is would be advisable to confirm it with indicators – such as volume.