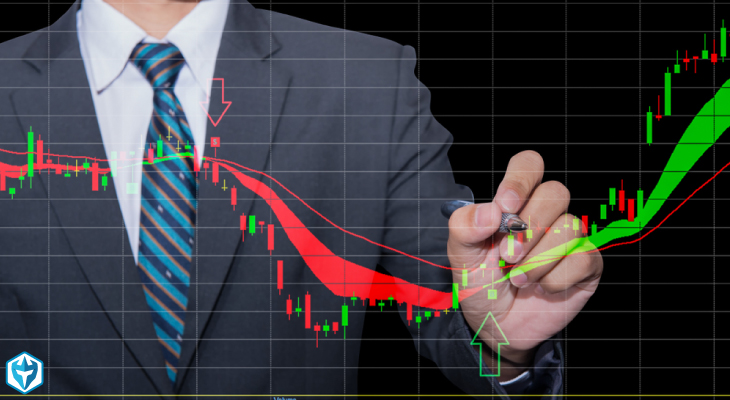
Trading is risky, and most day traders lose money. Read our full disclaimer.

Technical Analysis

Technical Analysis of Stock Trends

Technical Analysis of Stock Trends

Learning technical analysis of stock trends is a great way to develop your day trading skills especially when it comes time to enter or exit a trade. Although advanced software and nerves of steel are necessary ingredients for successful day and swing trading, one more component is needed: technical analysis. This third variable is how […]

Read more
Bollinger Bands

Bollinger Bands Explained for Beginners

  What Are Bollinger Bands? Bollinger Bands are a technical indicator developed  by John Bollinger in the 1980s that plot standard deviations around a moving average. Here’s an example chart:  Bollinger Bands widen as price volatility increases and tighten as volatility declines. Wider bands imply a higher standard deviation, meaning that an average price is […]

Read more