

Day traders use technical analysis indicators out of absolute necessity.
It would be incredibly difficult to make profits consistently on fast time frames by just relying on fundamental data.
As a trader, it is mandatory to use tools that show market data and price action to help you form decisions.
But what is technical analysis and how do technical indicators help traders make better decisions?
Which indicators do you add to your trading toolkit and how do you even pick them given there are about four-thousand indicators out there?
For markets that have fixed volumes like the stock market, few indicators are as powerful or useful as volume because it confirms trend directions.
However, there are other important indicators that compliment volume, which we’re going to look at later in this article.
But before going any further, let’s explain what the terms technical analysis and technical indicator actually mean.
What is a Technical Indicator?
To understand what technical indicators are, you need to first know what technical analysis is and who the individuals who practice it are.
In financial markets, technical analysis simply refers to the study of price action on a chart. Technical analysis mostly involves studying of price charts, which is why those that engage in it are called “chartists.”
A technical indicator, on the other hand, is a pattern-based signal that is derived by applying a formula to the price data of a financial instrument like a stock.
Technical indicators use mathematical calculations based on historical volume and price action to predict future price directions, providing traders with entry and exit signals.
These signals suggest a potential price and time for a trader to enter a trade, with the target of making a profit from the predicted move in price.
Simply put, indicators are tools that assist traders in using history to determine the most probable path of a stock’s price in the future and they form the foundation for technical analysis as a whole.
Having good knowledge of technical indicators is crucial when building you day trading strategies. Technical indicators can be used on any financial instrument with past trading data, including stocks, commodities, currencies, futures, etc.
Picking technical indicators for day trading stocks
If you are looking to day trade stocks, correctly predicting price directions is going to be a challenging task, but not impossible.
We know how important technical indicators, so we have compiled our top tips below as a comprehensive guide to choosing the best technical indicators for day trading stocks!
Volume
Volume is an important technical indicator that shows the liquidity of a stock which is useful for you to be able to enter and exit a trade.
One of the main benefits of using volume to day trade stocks, is it that it can help you confirm price trends and chart patterns because it indicates how much interest the stock is getting.
Generally, if you see high volume on a chart, it is an indication that there is more interest in the stock. Conversely, lower volume means less interest in the stock.
This is especially useful when a stock is breaking out from consolidation. The more volume there is on the breakout, the higher the likelihood the breakout will be successful.
Support
Support refers to the lowest point the price of a stock is likely to drop to before reversing and moving back toward the top.
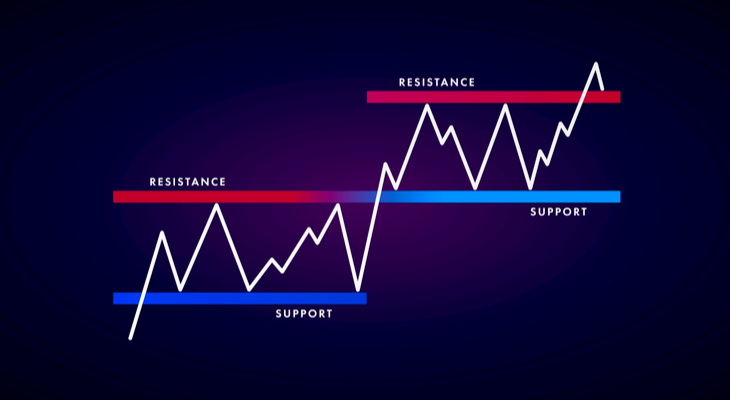
This is a psychological barrier which is based on the premise that the trading community simply will not allow the stock price to drop below this point.
All you need to do in order to determine where support lies for a given stock is to take a look at the stock chart. The lowest point on the chart is regarded as support.
The vast majority of traders use moving averages to find support and resistance levels since they offer a much more accurate support level. In terms of support as a single technical indicator, you should pick time frames that range from 30 to 90 days.
If a stock trades closer to support level, it is considered as more oversold. Therefore, we can make the assumption that prices will bounce off that support level and place trades around it.
Resistance
The opposite of a support level is a resistance level. Resistance refers to the point at which a stock that is moving on an upward trend is likely to hit a ceiling and start tumbling. Stocks trading closer to resistance are considered overbought.
Therefore, future short-term movement could be negative.
In order to find resistance, you just need to find the highest point the stock has hit on the stock chart. Moving averages can help you find a more accurate point of resistance.
However, focusing on the highest point of resistance during the past 30 to 90 days can prove more helpful.
The more times a price has been rejected off resistance, the stronger it is.
Relative strength index (RSI)
Relative strength index, or RSI, is a momentum indicator that day traders commonly rely on to determine the strength of price changes in the stock market. RSI is an oscillator, meaning that it is plotted on stock charts as two lines that move away from or toward each other.
The current RSI of a stock is shown as a numeric value from 1 to 100, giving traders information as to whether a stock is oversold or overbought.
If RSI is above 70, that implies that the stock is overvalued, or trading in overbought conditions.
In other words, this indicates that the stock price is set for a reversal from recent gains and likely to slump. If RSI rises far above 70, that suggests there is a higher chance of a reversal. Additionally, high relative strength index implies that momentum of the pullback will be strong.
If RSI is below 30, that is an indication that the stock is undervalued, or is oversold. Generally, this means that the stock price has been tumbling and is likely to reverse directions toward positive territory.
If relative strength index drops far below 30, it is an indication that a reversal is all but about to happen and the trend strength during the reversal will be intense.
Moving Average Convergence Divergence (MACD)

Moving Average Convergence Divergence (MACD) indicator, is a momentum indicator that is mostly used by traders to spot buy signals and sell signals.
Traders calculate MACD by subtracting the value of the 26-period exponential moving average from the 12-period exponential moving average to create the MACD line. A nine-period moving average of the MACD is then plotted on the chart for the signal line.
The two lines form an oscillator, which generally shows if a stock is oversold or overbought. These lines provide distinct signals when they cross one another, move close to each other, or away from each other,
When the MACD line crosses above the signal line, the price of the stock will is expected to increase (bullish crossover). If the MACD line moves under the signal line, it is a signal that price will fall (bearish crossover).
The further away the MACD line moves from the signal line, the more momentum is involved in the price action, providing traders even more details on the potential short-term price depreciation or appreciation and the degree to which the stock will go up or down.
Bottom Line
When day trading, it is important to utilize technical indicators and to use them in unison.
Although these indicators are most important for day traders and individuals aiming to make quick cash in the stock market, long-term investors can also count on these tools.
Nonetheless, it is important to remember that technical indicators are tools used to forecast future price movements of a given stock.
Bearing in mind that even the above indicators cannot yield accurate results, it’s advisable to combine them with superb research to raise your chances of profitability.
Moreover, it is important to use multiple indicators to determine and confirm price trends on stock charts.
Again, no single indicator will always give you a 100% accurate depiction of the future. But your probability of success will be much higher by confirming your findings through multiple indicators.