

If you’re new to the trading world, you might hear traders say that a stock is “thinly traded” in conversation and get a bit confused.
No worries, because you’ll come to see that us traders come up with loads of jargon for the simplest of concepts and most of the time there’s no complex explanation behind it.
In this case, a “thinly traded” stock refers to a stock that doesn’t trade that often.
Maybe only a handful of trades are made in the stock per day, compared to a stock like Apple (AAPL) which has hundreds of thousands of trades per day.
Why is this important? Because when you buy a stock, someone has to sell it to you, or if you want to sell a stock you own, someone has to buy it from you. If you want to buy or sell fast, someone needs to be waiting in the market to buy or sell from you at a fair price to both of you.
If there’s nobody waiting there in the market, you might have to advertise a high price to buy, to get a seller to sell their shares to you.
In an active stock like Apple, this isn’t a problem, because there’s thousands of people waiting to buy or sell at any given time at a fair price.
In a thinly traded stock, this could present a real problem. Let’s say you already own shares of the stock and you really need to sell. Maybe the price is going down, or you need to raise cash to buy a new house. Whatever the reason is, you need your money ASAP!
Well, if you really need to sell now, you have to accept whatever the currently highest bid in the market is right now. In a thinly traded stock, that might be significantly below the price the stock last traded at.
How Do You Know If a Stock Is Thinly Traded?
In the financial markets, there’s this idea of “liquidity,” which refers to your ability to quickly transact (buy or sell) in an asset like a stock, bond, or piece of property without getting a bad price.
Let’s use a real life example that we’re all familiar with.
Let’s say you’re a house flipper. You’re interested in a house that was foreclosed on and is in bad shape. The listing price is pretty attractive, and by talking to the realtor, you sense that you can get an even better price. You and your team are good at fixing houses, so you’re confident in that.
What’s the next worry, though?
Well, because you’re going to be taking out a mortgage on this house for the duration of your fix n’ flip operation, it’s going to cost you money every month that you own it.
So the quicker you flip it, the bigger your profit will be. In a really bad scenario, if you have a really hard time selling it, you might actually lose money on the sale simply because you had to pay so many mortgage payments before you sold it.
So you should really be concerned with how fast you can sell this house after fixing it.
You can determine that by looking at some local real estate statistics, like how long the average house is on the market, how many houses are currently on the market (the inventory), or how many houses in the neighborhood are cutting their listing prices (indicating that buyers aren’t interested).
In short, you’re concerned with the liquidity of this house.
You might buy it for $150,000, and know that it’s worth $250,000 after putting $50,000 into the project, making your profit $50,000.
But there’s a big difference between selling it for $250,000 the day you’re down with renovations, and selling it a year after renovations. The quicker you can sell this house when you want to, the better it’s liquidity is.
So how do we measure liquidity in the stock market?
There’s a few methods, and they’re quite simple.
The first is to check the stock’s volume.
Volume refers to the amount of shares of the stock traded back and forth in a given time period. If I tell you that the 20-day average volume of a stock is 100,000, that means, over the last 20 days, 100,000 shares of this stock traded back and forth each day on average.
You can find data on a stock’s volume from a number of free sources like Yahoo Finance, TradingView, or FinViz.
For example, let’s look up the volume for Airbnb (ABNB) stock on TradingView.com, which is a site for free stock charts.
Simply navigate to TradingView.com, click “Chart” on the top menu bar, and then type in the stock’s ticker symbol into the box on the upper right hand corner.

Now we have a chart of Airbnb (ABNB) stock with it’s daily volume plotted as a histogram on the bottom of the chart.
Simply mouse over today (the bar furthest to the right) and look at the number listed next to the “Vol” on the upper right portion of the chart. As you can see here, Airbnb traded about 15 million shares today. That gives us some good information to measure against.
Perhaps you want to invest $15,000 in Airbnb (ABNB) stock. That’s roughly 100 shares. The high trading volume generally makes it easier to buy or sell 100 shares of ABNB when the stock routinely trades millions of shares per day.
There will virtually always be someone willing to buy from you or sell to you at a price very close to the price ABNB last traded at.
Now let’s compare this to a very thinly traded stock, and you’ll quickly see where the trouble arises.
We’ll find a particularly illiquid stock on the TradingView.com stock screener, which you can access by clicking the “Stock Screener” tab on the bottom menu.

Once you have that screen pulled up, we’ll simply sort the list of stocks by volume in ascending order, meaning the smallest values first. In our list, one of the least active stocks is a wholesale distributor called AMCON, which routinely trades less than 1,000 shares per day.
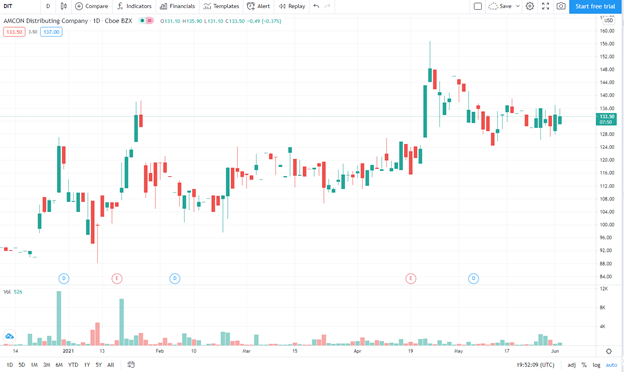
Imagine the same example as before: trying to buy or sell $15,000 worth of shares in this stock.
That’s about 112 shares. On the day of writing, this stock only traded 713 shares for the day, meaning you’d make up 16% of the day’s volume for that stock!
Compare that to the ABNB example, where the same $15,000 trade makes up only about 0.0007% of the day’s volume.
You might ask, what is the problem with making up a large portion of the day’s volume in a stock? Well, it’s because it prevents you from buying or selling quickly.
When it comes time to close your position, maybe the only person in the market willing to buy is bidding for a very low price. You’re forced to either wait (and risk the price moving against you), or take the bad price.
This doesn’t happen in active stocks like Apple or Airbnb because there’s so much trading interest in the stock, and tons of competition to buy or sell at the best price. In active stocks, most of the time, the last price the stock traded at is similar to the price you’ll be able to trade at.
Unless you’re a massive institutional investor (like a pension fund), liquidity isn’t a concern in the most active stocks.
How To Avoid Thinly Traded Stocks
Some investors specialize in thinly traded stocks. They hold for the long-term, so they don’t really care about being able to trade in and out of the stock quickly.
Their idea is usually that the thinly traded stocks aren’t followed actively by Wall Street investors, and therefore you can spot big opportunities in them early.
You’ll never be the first to know something about Apple, but it’s possible to be early in a small stock.
But short-term trading in thinly traded stocks is a very bad idea. The bid/ask spread is usually very wide, meaning that you’re paying a “vig” to get in and out, and the liquidity is very low. So as a trader, it makes sense to know how to avoid these stocks.
There’s a few telltale signs of a thinly traded stock, and they’re very easy to spot.
The first, as mentioned earlier, is the volume. The lower the volume, the lower the liquidity. However, an even quicker test is to just look at the stock’s chart.
The chart of an actively trade stock will generally look like this:
And we’re not referring to the direction or pattern of price movement, but the price bars themselves.
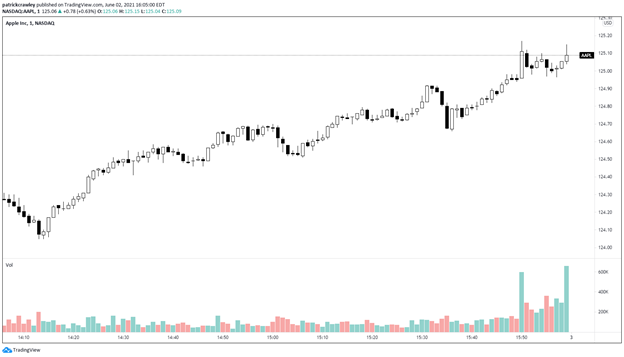
Above is a 1-minute chart of Apple (AAPL). Every bar represents one minute of trading activity in AAPL. The bottom of the bar represents the lowest price traded in the minute, and the top of the bar represents the highest price in the minute.
You see how every bar has multiple prices? That means several trades took place at different prices in that minute. In a thinly traded stock, you’ll see something that looks more like the following:

When an intraday stock chart looks like this, it means the stock is very inactively traded.
If you notice there’s only a handful of 1-minute bars (in this case, horizontal lines, because the stock only traded at one price for that minute) for the day of June 2nd. This means that there were several minutes between each trade which is the telltale sign of a thinly traded stock.
Another factor to pay close attention to is the bid/ask spread. The bid represents the highest price a buyer is currently bidding for the stock. You can sell your shares to the bid instantly. The ask represents the lowest price a seller is asking for the stock. You can buy at the ask instantly.
The difference between the bid and ask prices is known as the “bid/ask spread.” In the most active stocks like Apple, the spread is negligible, usually only representing a fraction of a percent of the price.
But in thinly traded stocks, the spread could be very wide.
For example, perhaps XYZ stock has a bid of $4.00 and an ask of $5.00, and you need to sell your shares. But maybe you want to sell at $4.50. You would have to enter an order into the market, which would sit on the order book until another trader is willing to buy your shares at $4.50.
And because thinly traded stocks don’t trade often, you might wait a while to get your order filled, if at all.
Bottom Line
Thinly traded stocks are dangerous because one large order can move the price significantly. If someone needs to sell their shares instantly, they will sell rapidly, to whoever is willing to buy, at whichever price.