

Much of the popular literature in technical analysis deals with the variation between trends and ranges.
Traders and investors tend to follow the herd, for better or worse, and whatever the dominant state of a market is, trend or range, traders tend to extrapolate into the future and expect to continue.
When these expectations are broken suddenly, we experience market volatility, which is just when prices change faster than normally.
When expectations are broken within a range, we call that a breakout. Everyone forgets about a stock as it bounces between a small range of prices and does nothing.
Until a piece of news comes out, or a big hedge fund is accumulating a bunch of stock, then it becomes clear that the range has broken, and everyone rushes in at once.
You can think of a breakout like a crowd rushing into a store at the opening of a Black Friday sale.
We’ve talked about breakout trading several times on this blog, but today we’re talking about reversal trading.
A trend reversal is when those expectations we talked about earlier are broken within a market trend. Traders become accustomed to the fact that a stock is trending, and they follow in the trend direction. Then when that trend breaks and the party’s over, everyone rushes for the exits.
You can think of a trend reversal as the opposite of a breakout. A breakout is typically the birth of a new trend, while a trend reversal terminates a trend.
When you consider trends and ranges in this context, you can see that both breakouts and trend reversals are just market surprises. And surprises in the stock market create volatility and uncertainty.
Traders that capitalize on these strategies aim to identify the circumstances where the crowd is herded on one side of the market when a surprise is imminent because these are the trades where they can achieve an outsized return relative to their risk.
The real challenge, of course, is figuring out when the market will get surprised while losing the minimum when you’re wrong.
In this article we’re going to review how applying technical analysis can potentially help you spot trend reversals, as well as address some of the frequent mistakes made in this area.
A Note on Trend Reversals
Before we get into spotting trend reversals, it’s important to note a potential misconception some may have about trend reversals, which is that a new trend in the opposite direction immediately begins.
The popular phrase “trend reversal” isn’t entirely accurate in this case.
Instead, it’s more like the market takes a breather and enters a range before deciding where it will go next.
This is especially true in the stock market, which has more of a tendency towards mean reversion, while commodities and bond markets tend to have a stronger tendency towards strong and long trends. These statistical tendencies are why traditional Turtle-style trend following models don’t work in the stock market.
However, that doesn’t mean that you can’t capitalize on trend reversals. All it means is that you might not want to bank on an entirely new trend beginning in the opposite direction, and instead play for the short-term counter-trend move.
The main idea behind this trade setup is that you’re capitalizing on the short-term trend traders all cashing out at the same time when they notice the trend weakening.
Sometimes you’ll end up on a runaway train where a new trend in the opposite direction occurs. These are great, but keep in mind the majority of these setups last for a few bars before traders get bored and the market seeks equilibrium, bouncing around without any discernible trend.
Failure At Previous High
At its most basic, a trend is a series of higher highs and higher lows (vice versa for downtrends).
If we agree on that, we have to agree that a trend is under suspicion, if not completely terminated, when it fails to make a new high, or makes a lower high.
Below is an example of what a trend “under suspicion” might look like. At Swing C, the price failed to penetrate the most recent high at Swing B. Immediately, the trend is under suspicion, and the next few price bars will determine if the trend will continue.
Remember, a trend is a series of higher highs and higher lows, and the high at Swing C is not a higher high, so it doesn’t really meet the technical definition of a trend anymore.
This is an indication of traders’ decreasing aggressiveness and willingness to push prices higher.

However, we’ve all seen those trends that experience momentary weakness at a recent high, fall into a short-term range near the recent high, only to break out and continue with even more momentum than before.
This is what you might call a “complex pullback”.
Little details like these make trend trading trickier than it might seem in theory.
This is why it’s paramount to pay attention to the character of the price action around the high. There’s a significant difference between a doji candle right at the previous high, and a big hammer candlestick at the previous high.
The dividing factor here is price rejection.
When the market moves against the previous high with a lot of conviction. Below is an example of what we’re referring to:

This is a situation where the market is telling you that traders not only cannot establish a new high, but that the market staunchly rejected even the previous high. It indicates that sellers are gaining ground and the trend is very likely over.
Momentum Dying Out (Momentum Divergence)
You can look at momentum as the speed of price change. A ‘momentum stock’ is a stock that moves up (in percentage terms) very quickly.
Trends live and die on momentum. In order to sustain a consistent pattern of higher highs and higher lows, there needs to be a continuous source of aggressive buyers willing to pay ever-higher prices.
There’s a hundred ways to quantify momentum, but most traders use one of a few technical indicators like MACD or ADX to gauge momentum. No need to over-complicate things.
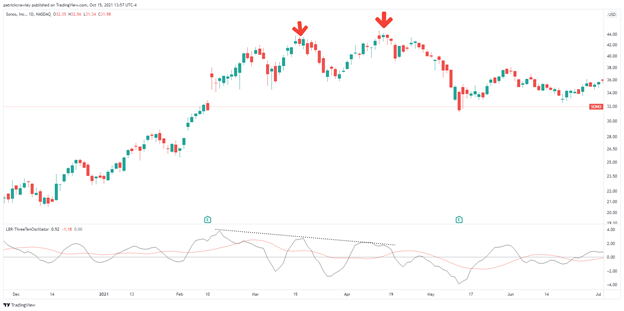
Here’s an example of an orderly stock trend which ran into trouble when momentum started declining.
The stock failed at a previous high twice in a row (marked by the red arrows) on declining momentum, as marked by the lower highs being made on the modified MACD indicator:
Overextension
Every trader can identify an overextended market. A stock’s price is growing at a rate that, if extrapolated into the future, would make the stock a trillion dollar company in a year. It’s obvious that the trend has to slow down pretty soon.
However, if you’re even one or two bars too early, you could be sitting there with a massive loss.
Of course, you will set a stop loss, but if the trend continues with a similar level of momentum, you’ll likely experience some slippage. Overnight trades are vulnerable to violent gaps through your stop.
All of this has to be factored into playing a reversal on a stock that is going parabolic.
One way to identify overextended stocks is using channels like Bollinger Bands or Keltner Channels.
When you have several consecutive bars where both the high and the low are completely outside of the bands, as well as the bar range being at least twice the average range, that’s an overextended stock that will experience volatility contraction soon.
These are parameters that you can easily punch into a screener if it’s customizable enough.
Of course, you could always keep it simple and use an indicator like RSI to screen for very high values to find overextended stocks.
The key matter with overextended stocks is that you need a level off which you base your risk, and there needs to be some suggestion from the market that there’s potential for a reversal, or at least weakness.
Most of the time this ‘suggestion’ is in the form of what I call ‘parabolic traffic.’
This is when a few candles cluster together in the same area without any discernible advancement or decline. There’s usually large wicks, indicating market indecision.
Here’s an example of this ‘parabolic traffic’ I’m referring to, from a stock called Ideanomics (IDEX) back in July 2020:

The Intraday Trap
Many intraday trends see significant strength in the first hour of regular trading hours, only to slow down for the rest of the day, possibly catching a bit of steam again in the last half hour of trading.
It’s tempting to see this tendency and start fading stocks in the afternoon, but the problem occurs that so many of these trends don’t completely peeter out, and instead they just stop rallying so much. So a sizable portion of your trades will be small wins or scratches, while on many of them you’ll be taking a loss of your full risk on the trade.
Of course, any trader trading any strategy will experience headfakes.
The key is to do everything in your power to minimize these so your expected value is above 1. Beyond reflecting on the things in this article, review your trades, study literature on technical analysis, etc.
Bottom Line
Technical analysis books are littered with strategies for reversal trading. It’s less important the specific setup you use, and more that you’re prudently applying sound trading principles.
Trading reversals are highly risky and they’re quite tough for beginner traders to navigate.