

Day traders usually focus on maximining their trading profits, and moving averages are one of the technical analysis tools some of them use to achieve that goal.
Moving averages are applied to help determine trend direction, strength, and to find entry and exit points.
They can also be used with other indicators to create trade signals. MAs come in several forms, such as simple, moving average convergence divergence, and exponential.
In the following paragraphs, we will take a closer look at one great moving average that traders can apply when trading in today’s more volatile markets.
Weighted Moving Average (WMA)
The weighted moving average is a weighted form of the simple moving average that puts more emphasis on more recent data points because they are more relevant than past data points.
Each data point is multiplied by its respective weight, summing them, and dividing by the number of intervals. The weighting is determined by the number of points chosen.
The sum of the weights should add up to 100 percent.
However, they are distributed such that, for example, the oldest closing price in a ten-day moving average is weighted only 7% while the most recent closing price is weighted 33%.
WMA can be used with any price including the open, close, high, or low price, and can be incorporated with other technical indicators as well.
This moving average smoothens a data series, which is important in a volatile market because it helps traders to identify trends much more easily.
How the weighted moving average is calculated
The idea behind weighted moving averages is that recent prices are more reliable as far as anticipating the price movements is concerned. That being said, calculating a weighted moving average involves three steps.
First, you need to choose the period of the weighted moving average to be calculated.
Second, calculate the weight to be assigned to the prices. Finally, calculate the weighted moving average using the following formula
WMA = (P1 * 5) + (P2 * 4) + (P3 * 3) + (P4 * 2) + (P5 * 1) / (5 + 4+ 3 + 2 + 1)
Where: P1 = current price
P2 is the price of the previous price, and so forth.
In short, WMA = (Sum of weighted averages) / (sum of weights)
Example
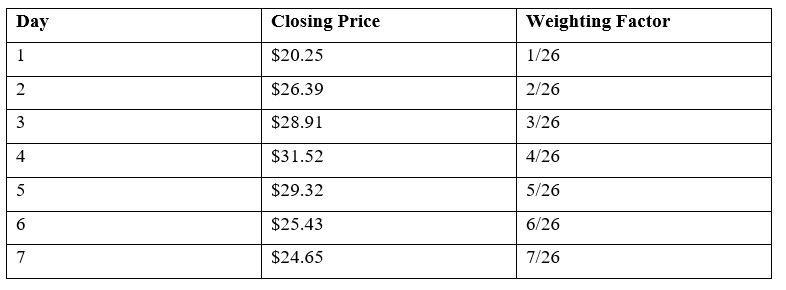
Let’s assume that we want to calculate the WMA of five stock prices over a seven-day period.
The prices are $20.25, $26.39, $28.91, $31.52, $29.32, $25.43, and $24.65, with the last price being the most recent.
Since we have the prices that we want to average, the next step is to assign a weighting to each price based on how recent the price is and the given period.
Then we multiply each of the seven closing prices by their respective weighting factor to find the weighted average.
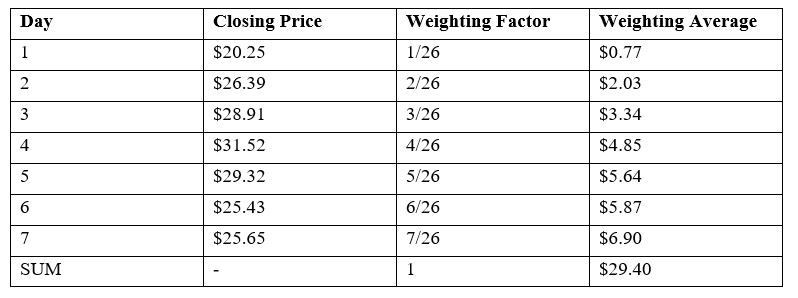
After that, add up all of the weighted average individual values in order to get the weighted moving average.
The weighed moving average for the five stock prices during the 7-day period is $29.40.
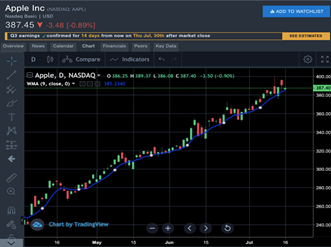
WMA indicator appears as a line directly on a price chart as shown above. If the line is moving above the price action, it suggests a downward trend while a line moving below the price points towards an upward trend.
Using WMA to make trade decisions
Weighted moving averages are often used for filtering out noise (i.e., smoothing irregular fluctuations) in a time series to allow traders and chartists to better reveal trend patterns over time.
Traders use WMAs in the same way and for the same intent as the other moving averages.
But the advantage of WMAs is that they provide earlier and stronger indications to trend reversal and direction because they focus on the more recent price data.
Here are a number of ways that the weighted moving average can be used by day traders.
- To help measure price movement: The WMA generally reacts more quickly to price movement making it a more convenient measure as well as spotting potential trends sooner compared to the simple moving average.
- To spot trade signals: The weighted moving average can also be combined with other technical tools to give ideal trade signals.
- To determine trend direction: When the price is below its WMA line, it is normally a signal that on average, the stock is trading lower than it has over the period being analyzed. This in turn confirms a downtrend. On the flipside, when the price is above the weighted moving average line, then it confirms an uptrend.
- To validate market momentum and price strength: Price action below its moving average shows that the market is getting weaker relative to where it was in the past since the most recent prices now sit lower than the average. Alternatively, price action above its moving average shows that the market is getting stronger relative to where it was in the past.
- To indicate resistance and support areas: A rising WMA can signal support for price action over a given period, while a falling weighted moving average can signal resistance to price action. This as a strategy that is commonly used by traders to place sell orders when the price is near the falling WMA or to place buy orders when the price is near the rising weighted MA.
Bottom Line
Most day traders will concur that technical indicators are at the center of any trading strategy.
Even though there are many types of indicators that traders can use in chart analysis today, the weighted moving average is still one of the most popular.
Weighted moving averages assign more importance to more recent price values and therefore react quicker to price changes than simple moving averages. WMAs also tend to stick closer to the trend.
But as is the case with other technical analysis tools, you need know how to use and interpret the weighted moving average to get the best possible results on your trades.