

- What Is a Gap Fill Trading Strategy?
- Why Do Stocks Gap Up or Gap Down?
- News and Overnight Catalysts
- Pre-Market Imbalances
- What Does It Mean When a Stock “Fills the Gap”?
- Common Types of Gap Fill Setups
- Gap Up Followed by Selling Pressure
- Gap Down and Failed Bounce
- How I Think About Trading Gap Fill Stocks
- Identifying the Gap Level
- Entry Signals I Look For
- Risk Management Matters More Than the Idea
- Why Gap Fill Trades Can Be Risky
- Strong Stocks That Refuse to Fill
- Choppy Price Action at the Open
- Gap Fill Strategy vs. Momentum Trading
- When a Gap Fill Strategy Makes Sense
- Final Thoughts
Watch Full Video Here: Case Study of a 113% Gap and Go Day Trading Setup
Gap fill trading is something a lot of traders hear about early on, but not everyone understands how it actually works in real market conditions. Some gaps fill quickly. Some never fill at all. And trying to force a gap fill trade on the wrong stock can get you into trouble fast.
In this article, I want to break down what a gap fill trading strategy is, why gaps form, how gap fills happen, and when they make sense as a day trading setup.
What Is a Gap Fill Trading Strategy?
A gap fill trading strategy is based on the idea that when a stock opens significantly higher or lower than its prior day’s closing price, it may retrace back to that previous close at some point during the trading session. That retracement is what traders call filling the gap.
In simple terms:
- The stock closes one day at a certain price.
- Overnight, it gaps up or down.
- During the next trading session, the price moves back toward the prior close.
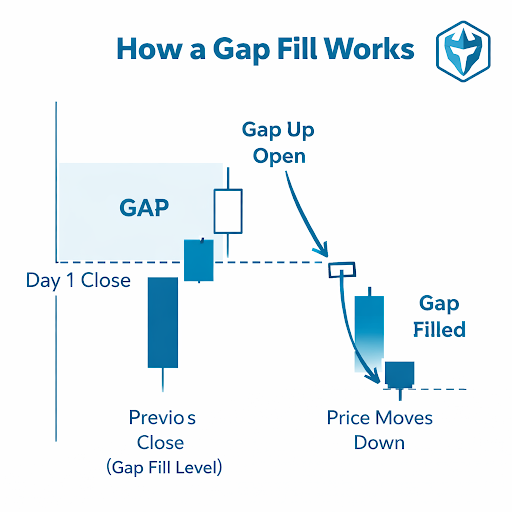
That prior close becomes an important reference level, and many traders watch it closely.
Just because a stock gaps up doesn’t mean it’s strong. Sometimes, the gap itself is the emotional move, and once the market opens, reality sets in.
Why Do Stocks Gap Up or Gap Down?
Stocks gap for a few common reasons, and understanding the why matters just as much as the setup itself.
News and Overnight Catalysts
Most gaps are driven by overnight news like earnings reports, press releases, FDA decisions, mergers, or analyst changes. That information shifts supply and demand before the opening bell, causing prices to open far away from the prior close. By the time the market opens, much of that reaction has already happened.
Pre-Market Imbalances
In pre-market trading, volume is lighter, and liquidity is thinner.
That means:
- Large orders can move price quickly
- Market makers adjust bids and offers aggressively
- Price can jump far away from the prior close
When the regular session opens and liquidity increases, price often stabilizes or retraces. That’s where gap fill behavior can show up.
What Does It Mean When a Stock “Fills the Gap”?
When traders talk about a gap filling, they’re usually referring to price revisiting the prior day’s closing price.
There are a few variations:
- Full gap fill: Price returns all the way to the prior close.
- Partial gap fill: Price retraces part of the gap but doesn’t fully close it.
- No gap fill: Price holds above or below the gap level and continues trending.
One thing I always remind traders is this: Gaps don’t have to fill. A gap fill is a tendency, not a rule.
Common Types of Gap Fill Setups
Not all gap fills look the same. Context matters.
Gap Up Followed by Selling Pressure
This is one of the most common gap fill scenarios I see. Here’s how it usually plays out:
- The stock gaps up on news
- Early buyers chase the open
- Sellers step in as profit-taking begins
- Price starts fading toward the prior close
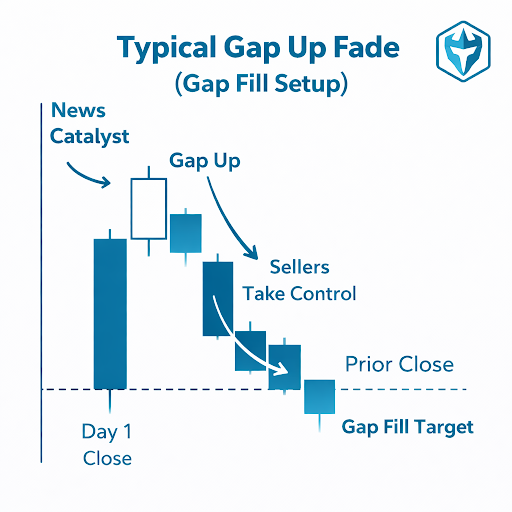
In these cases, the gap itself was the excitement. Once that excitement fades, the stock can bleed lower.
Gap Down and Failed Bounce
Gap downs can also attempt to fill, especially when panic selling happens at the open. Often, I’ll see:
- A sharp drop overnight
- A weak bounce after the open
- Sellers reassert control
- Price continues filling the gap lower
These setups can be tricky because bounces can look convincing before failing.
How I Think About Trading Gap Fill Stocks
I don’t treat gap fills as guaranteed outcomes. I treat them as potential scenarios that need confirmation.
Identifying the Gap Level
The first thing I mark on my chart is the prior day’s closing price. That level acts like a magnet, but only if conditions line up.
I’ll also pay attention to the pre-market highs and lows, key intraday support and resistance, and VWAP (Volume Weighted Average Price).
Entry Signals I Look For
I don’t short or buy just because a gap exists. I want price action to tell me the story. Some signals that catch my attention include:
- Failed breakouts near the open
- Weak bounces into resistance
- Rejection at VWAP
- Increasing sell volume as price fades
I always want the stock to prove it’s weak before I bet against it.
Risk Management Matters More Than the Idea
Gap fill trades can move fast, and they can move against you just as fast.
I always define my stop level before entering, my max loss for the trade, and my position size based on volatility. If the gap doesn’t start filling, I’m not going to argue with the market.
Why Gap Fill Trades Can Be Risky
One of the biggest mistakes traders make is assuming every gap will fill.
Strong Stocks That Refuse To Fill
Some stocks gap up and never look back, especially when institutions are involved. When buyers continue stepping in, volume stays elevated, and price holds above VWAP. Shorting those stocks just because there’s a gap below can lead to repeated losses.
Choppy Price Action at the Open
Gap days are often volatile, with fast reversals and sudden spikes driven by algorithms. The open is where traders get chopped up. If price action feels sloppy, sometimes the best trade is standing aside.
Gap Fill Strategy vs. Momentum Trading
This is an important distinction. Gap fill trading is usually a mean-reversion idea. You’re betting that price returns to a previous level. Momentum trading is the opposite. You’re betting that strength continues.
Mixing the two is dangerous. If I’m trading a gap fill, I’m not expecting a breakout. If I’m trading momentum, I’m not fighting the trend. You have to pick a thesis and stick to it.
When a Gap Fill Strategy Makes Sense
Gap fills strategy work best in specific conditions, so I’m selective about when I look for them.
I’m more interested in gap fills when the overall market is weak or choppy and momentum isn’t clearly pushing stocks higher. If a stock gaps up but fails to show strong follow-through, that’s a red flag.
When volume fades shortly after the open and price struggles to hold important levels, it often means the gap was driven by emotion rather than real buying interest.
If the news is strong, volume stays heavy, and price holds VWAP with higher lows, I’m much less interested. Strength like that usually means the gap may not matter that day.
Final Thoughts
Gap fill trading isn’t about predicting what should happen. It’s about reacting to what is happening.
Some days, gaps fill cleanly. Other days, they don’t fill at all. My job as a trader isn’t to force the trade. It’s to manage risk, stay disciplined, and protect my account.
As I often remind myself, “Green is good, and there’s always another trade tomorrow.” For more resources on day trading and simulators, join me at Warrior Trading.