


Volume is an important indicator that shows the liquidity of a stock which is important for day traders to be able to open and close a trade. So in this article we are going to look at how to use volume to improve your day trading.
The more market players that trade a stock, the simpler it is to jump in and out of a trade quickly.
Learning to interpret volume brings many benefits and could be of great help when it comes to day trading stocks. Make sure to pay close attention when you see huge volume spikes on charts, no matter what the time frame.
In this blog post, we will discuss the importance of volume and how you can use this powerful indicator to improve your day trading. So, let’s begin by explaining what volume is and how it is calculated.
What is Volume?
Basically, volume refers to the number of shares a stock has traded hands. In other words, it is a measure of how much a particular financial instrument has been traded within a given period of time.

In public stock markets such as the Nasdaq or New York Stock Exchange, transactions are recorded and publicly displayed.
Traders can access a list of all transactions at any point during the day, including exactly when a stock changed hands, the various prices at which the stock changed hands, and the number of shares (volume) that were traded every time.
Therefore, it is quite easy to know the total number of shares that changed hands during a given period of time.
For example, at the time of writing this blog post, Tesla’s session volume was 30.096 million. That means for the session up to that point, 30.096 million shares of Tesla were traded.
Using Volume For Day Trading
There are numerous advantages of using volume to day trade various financial instruments.
Firstly, volume can help you confirm chart patterns and price trends, as it indicates how much interest the instrument is getting. In general, higher volume means more interest in the stock, while lower volume means less interest in the stock.
The higher the trading volume in a particular market or stock, the more liquid that market or the stock is considered.
High liquidity attracts plenty of buyers and sellers and makes it easy to trade. On the other hand, when a stock has low liquidity it is hard to come across buyers and sellers.
Secondly, a change in volume relative to previous volume trends (Relative Volume) often causes the price of a security to move. And finally, the trend in a volume indicator over a longer time period helps determine when the price is losing momentum and is relevant to the price trends.
Let’s dig deeper to find out how day traders can rely on volume to confirm chat patterns, breakouts, reversal trades, and trends.
Using it for breakout confirmation
A breakout trade is when a stock moves above or below a significant level of support or resistance after missing to do so in earlier attempts. The break of this significant level can trigger a new trend and a huge price move.
When a breakout happens, it is telling you that there is a shift in demand and supply. As buyers or sellers become more aggressive, this can cause an imbalance big enough to sustain the breakout through the channel.
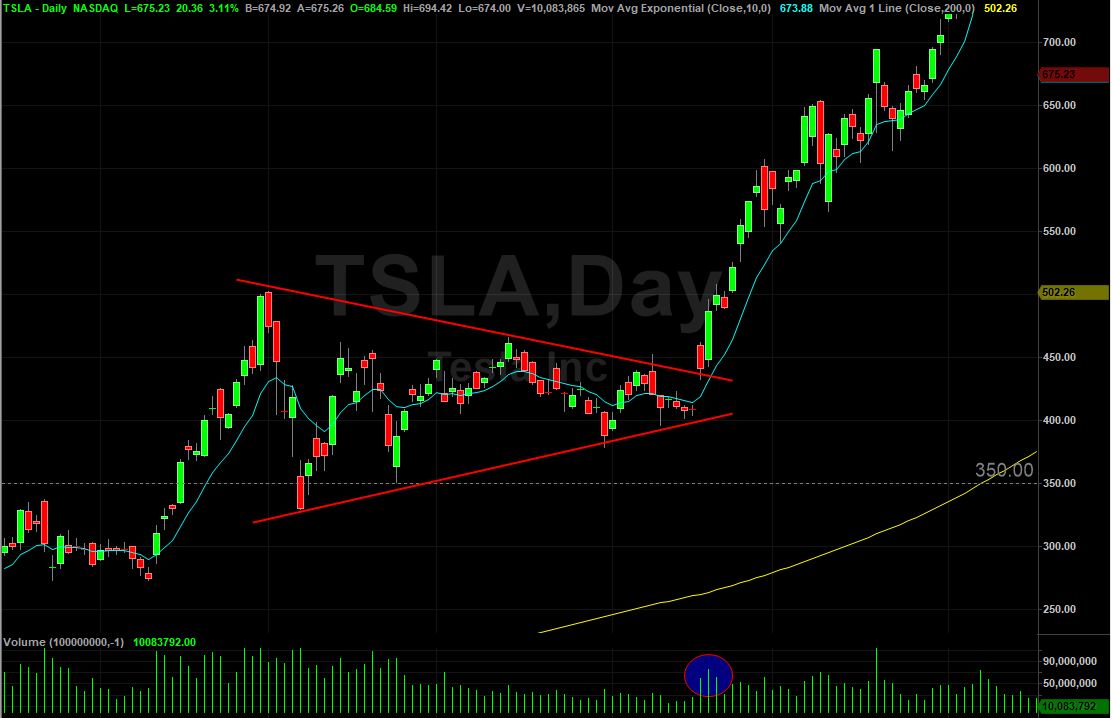
Above is a great example of a breakout trade with volume confirmation. Tesla was consolidating in a pennant formation where a defined support and resistance line were tightening over time.
When prices broke above the resistance line, volume spiked and prices dramatically moved higher. This is a picture perfect breakout with volume confirmation that can be used on any time frame.
One thing to keep in mind is when prices breakout like this, they tend to come back and test that line which should act as support now. As long as prices can hold above that line, then the likelihood of a move higher is even better.
Volume is a crucial component to this shift. If the breakout happens on low volume, the level of aggression is low and the move may not be sustained or could be a false breakout.
High volume on a breakout indicates that increased interest with more traders support the move.
Using it for reversal trades
As the name suggests, a trend reversal is sentiment shifting from an established trend to, a new trend forming in the opposite direction, for example, downwards to upwards trend or vice versa.
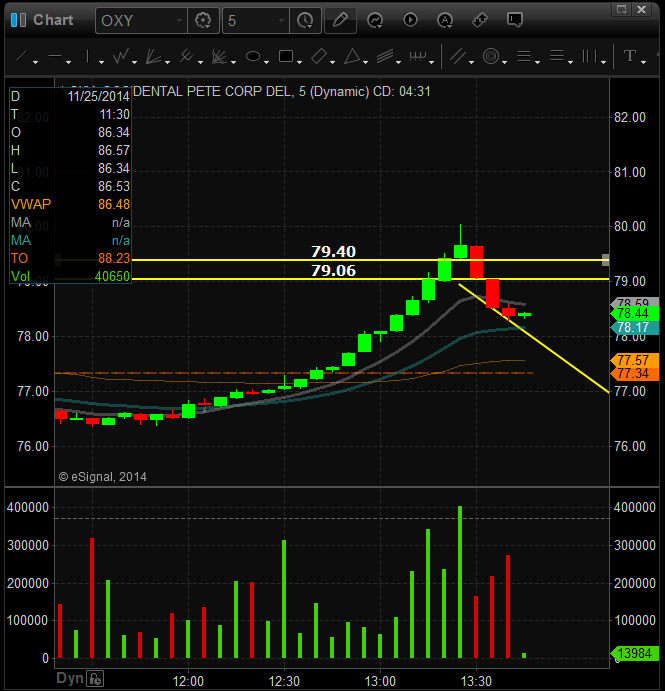
Above is a great example of a reversal with a volume spike at the top of a strong move. The volume signifies the battle between buyers and sellers is peaking, with buyers likely to be overpowered by the sellers.
Reversal trading can be rewarding. Getting into a trade at the start of a new trend is one of the most profitable trades. However, it is also risky and there is a big chance of failing.
The risk of remaining in a trade that is reversing is loss of potential profit in that position if one delays exit.
Before considering any reversal trading setup, you need to look for price bars that have volume spikes near the trend extreme, a confirmation of a reversal, and an entry point.
Price bars with volume spikes at trend extreme are the cornerstone of reversal trading. It confirms that the institutional investors are interested in the market. Forget about a reversal if the trend extends beyond the volume spike bars without pausing.
But since not all volume surges cause reversals, traders need to wait for supporting evidence to raise the possibility of this trading method. Make sure the stock has made make a convincing attempt to reverse. This can be a powerful price thrust or a trend line break.
Finally, you need to decide when precisely you want to get into a trade. You can use a bounce from a support or resistance zone, or a price pattern. Picking a well-timed entry can greatly help to minimize your risk.
Trend confirmation
Trend trading ought to be a staple in your day trading account.
Trend is used to identify the predominant direction a stock is heading and to look for opportunities that trade in the same direction.
However, sometimes it is hard to tell whether a chart displays a trend or not. Some traders might also find it difficult to know when a trend has come to an end and price starts to reverse. The volume indicator can help you in both of those cases.
Pay attention to the correlation between volume and price. Increasing volume and price show more traders are willing to buy the stock while decreasing volume and increasing price show a lack of bullish sentiment, and possibly a potential reversal.
In trend trades, volume should always be in favor of the direction of the trend. So if prices are trending higher, we would want to see higher volume on up moves.
Bottom Line
Volume is an important indicator that every day trader should understand.
Generally, you want to look for stocks that have high volume. Rising volume and price often mean buyer interest, which makes the stock more liquid, and quicker and easier to buy and sell.
Traders can measure volume using multiple ways, including the selected time frame, relative volume, session, and over a given period of days.